
Figure 3. STN-HFS induces excitatory and inhibitory evoked responses in SNr neurons.
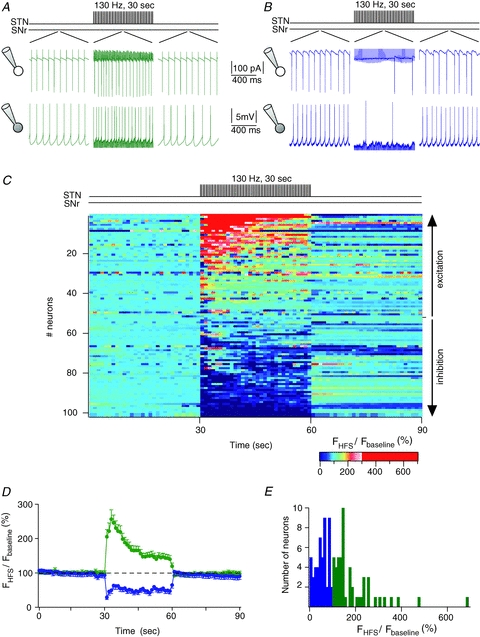
A and B, examples of excitatory (A) and inhibitory (B) evoked effects induced by STN-HFS. Firing activity of SNr neurons, 1 s before, during and after a STN-HFS, are illustrated by raw traces recorded in cell-attached (top traces) and in whole-cell (bottom traces) recordings. Stimulation artifacts due to STN-HFS were partly removed for the clarity of the figure. In A, the mean firing rate was increased to 242% and 146% during STN-HFS, in cell-attached and whole-cell, respectively. In B, the mean spiking frequency was decreased by 53% and 21%, in cell-attached and whole-cell, respectively. C, colour-coded firing rates of SNr neurons (n = 101) before (30 s) STN-HFS, during STN-HFS (30 s) and just after the STN-HFS (30 s). Each line represents one SNr neuron (time bin size, 1 s). The mean firing frequency per second is colour-coded (normalized for each neuron to the mean firing rate observed during the 30 s preceding the STN-HFS). SNr neurons were organized from the most excited (top line) to the most inhibited cells (bottom line) by STN-HFS, as indicated by vertical arrows (right side). D, mean discharge frequency of SNr neurons during STN-HFS (FHFS) normalized to the mean discharge frequency during 30 s before the stimulation (Fbaseline) (mean% s−1± SD). SNr neurons were separated into two groups depending on their excitatory evoked response (n = 52, green) or inhibitory evoked response (n = 49, blue) during STN-HFS. E, distribution of mean evoked effect across recorded neurons (bin size, 10%). In blue are represented the neurons that are inhibited by the STN-HFS and in green, the neurons that are excited.