
Figure 4. Excitation–inhibition balance in SNr neurons depends on intensity and frequency of STN stimulation.
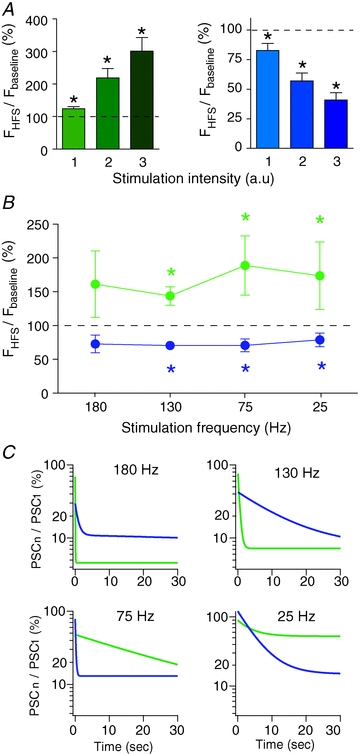
A, impact of the intensity of STN-HFS stimulation on the evoked effect in SNr neurons. The excitatory (left graph) and inhibitory (right graph) responses increased with increasing intensities. Intensity of the STN stimulation was divided into three groups in arbitrary units (a.u.): excited neurons: group 1: 2.01 ± 0.17 mA, group 2: 2.98 ± 0.21 mA, group 3: 4 ± 0.26 mA; inhibited neurons: group 1: 1.63 ± 0.12 mA, group 2: 2.5 ± 0.17 mA, group 3: 3.58 ± 0.24 mA. B, relationship between excitatory and inhibitory responses and STN stimulation frequency (excitation: green; inhibition: blue). C, evolution of synaptic currents during STN stimulation for 180, 130, 75 and 25 Hz. Each PSC (PSCn), evoked by STN stimulation, was normalized to the first PSC (PSC1). Curves (excitatory currents: green; inhibitory currents: blue) result from exponential fits (n = 10–12 neurons per frequency). *P < 0.05.