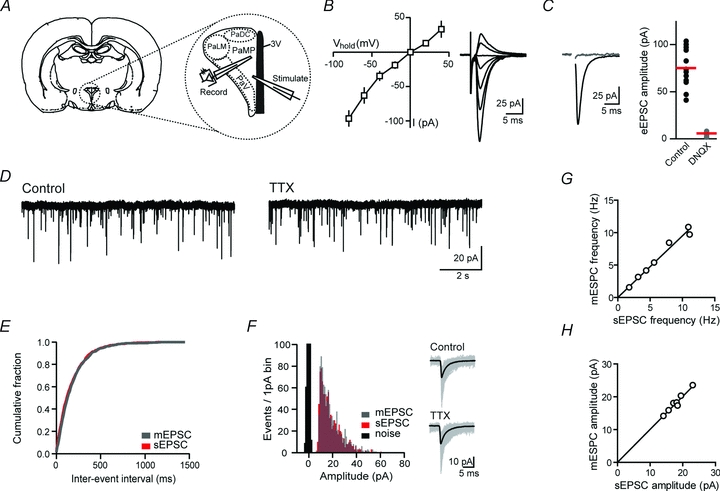
Figure 1. AMPA receptor-mediated synaptic transmission in parvocellular neurosecretory cells.

A, schematic diagram of coronal brain slice illustrating the location of stimulating and recording electrodes in expanded view of PVN. Adapted from Paxinos & Watson (2005) and reproduced from Wamsteeker et al. (2010) with permission. B, current–voltage relationship (left) and AMPA receptor-mediated synaptic currents (right). C, sample traces (left) and summary plot of effect of DNQX (10 μm) on synaptic currents. D, sample quantal events in control and after application of TTX (1 μm). E, cumulative fraction plot of sEPSC and mESPC inter-event intervals from the neuron in (D). F, amplitude distribution histogram of sEPSCs and mEPSCs from the neuron in D; inset shows individual (grey) and average (black) quantal events in control and after application of TTX. G and H, summary plots of sEPSC versus mEPSC frequency (G, slope = 0.95 ± 0.03) and amplitude (H, slope = 1.01 ± 0.01).
