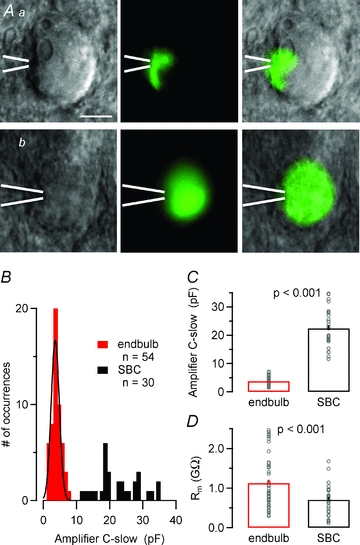
Figure 1. Unequivocal identification of endbulb of Held terminals.

A, IR-DIC (left) and fluorescence (middle) images of spherical bushy cells in a brain slice taken after direct presynaptic (Aa) or postsynaptic (Ab) whole-cell recording. The intracellular recording solution contained a fluorescent dye. Overlays of both images are shown in the right column. Presynaptic recording sites were confirmed by exclusion of the fluorescent dye from the postsynaptic neurons. Position of the recording pipette as indicated by the white bars. Calibration bar corresponds to 10 μm. B–D, pre- and postsynaptic compartments can be easily distinguished by virtue of their divergent passive membrane properties. B and C, frequency distribution (B) and means (C) of the whole-cell capacitance (reading of the amplifier's C-slow cancellation setting) suggest a ∼6 times smaller surface area for endbulb terminals compared to bushy cells. Note that the two frequency distributions in B do not overlap. The smooth black curve in B represents a Gaussian fit with a mean = 3.6 pF and SD = 1.7 pF. D, presynaptic terminals had higher input resistance than postsynaptic SBCs. Rm was determined from the passive current responses elicited by hyperpolarizing voltage steps from Vh = −80 to −90 mV.
