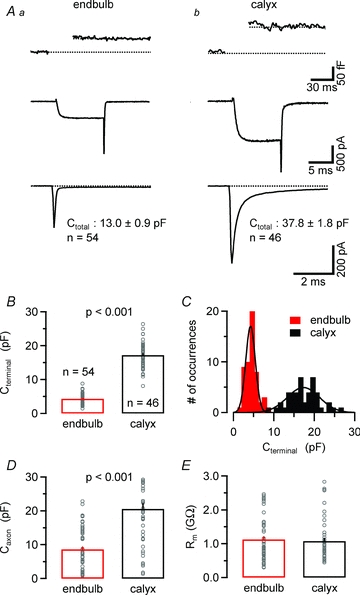
Figure 2. Comparison of passive membrane properties between endbulb and calyx terminals.

A, changes in membrane capacitance (ΔCm, top panel) elicited by step-depolarizations (10 ms, from Vh = –80 to 0 mV). The corresponding ICa(V) are shown in the middle panel. The total resting membrane capacitance of the terminals (Ctotal) was estimated from integrals of passive current transients elicited by hyperpolarizing steps to –90 mV (bottom) recorded in whole-cell voltage clamp after compensating the pipette's capacitance in cell-attached mode. Ctotal was on average ∼3 times smaller for endbulb terminals. Capacitive current transients of most terminals decayed double exponentially suggesting a variable contribution of the attached axon to the total membrane capacitance. B–D, to distinguish the whole-cell capacitance of the terminals (Cterminal, B and C) from that of the attached axons (Caxon, D), we separated the capacitive current transients into fast and slowly decaying components. On average, endbulb terminals had a ∼4 times smaller Cterminal (B) with a larger coefficient of variation (C) suggesting more variable size of these terminals. The smooth black curves in C represent Gaussian fits with means of 4.25 pF vs. 17.3 pF and SDs of 1.68 pF vs. 5.63 pF for endbulb and calyces, respectively. E, input resistance was on average ≥1 MΩ for both endbulb and calyx terminals.
