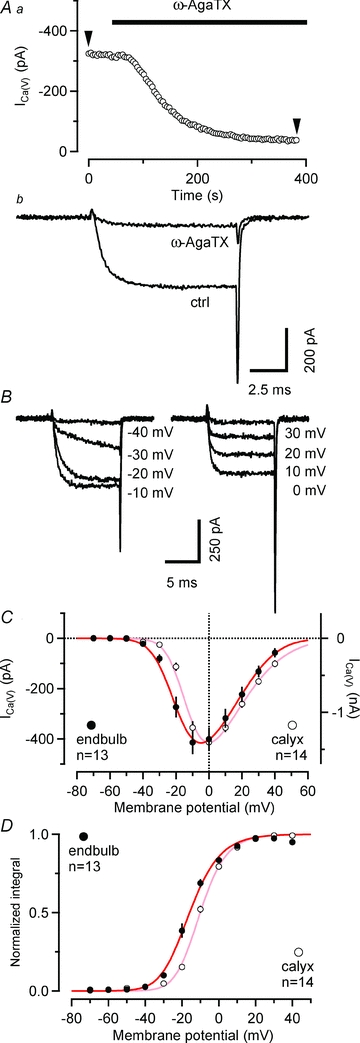
Figure 3. Properties of voltage-gated Ca2+ currents in endbulb terminals.

A, P/Q-type VGCC account for ∼86% of ICa(V) in endbulb terminals. ICa(V) was elicited every 3.9 s by depolarizing voltage steps (10 ms, from Vh = –80 to 0 mV) while ω-AgaTX (200 nm) was applied to the external solution as indicated by the bar. Time course of block (Aa) and individual sweeps (Ab) representing the amplitude values at arrowheads. B and C, current–voltage relationship of ICa(V) in endbulb and calyx terminals. B, ICa(V) was elicited in an endbulb terminal by step depolarizations (10 ms duration) from Vh = –80 mV to the potentials indicated next to each trace. C, I–V curves obtained from peak amplitudes of ICa(V) from 13 endbulb (black) and 14 calyx (grey) terminals. The smooth red curves represent fits to the data points using a modified form of the constant-field equation (see Methods eqn (2)). D, normalized tail current integrals of 10 ms step depolarizations plotted as a function of Vm to estimate the steady-state activation parameter  . The smooth red curves represents fits to the data points using a squared Boltzmann function with half-activation voltages V0.5 = −24.4 mV (endbulb) and –17.4 mV (calyx) and steepness factors κ = 9.63 mV (endbulb) and 8.23 mV (calyx).
