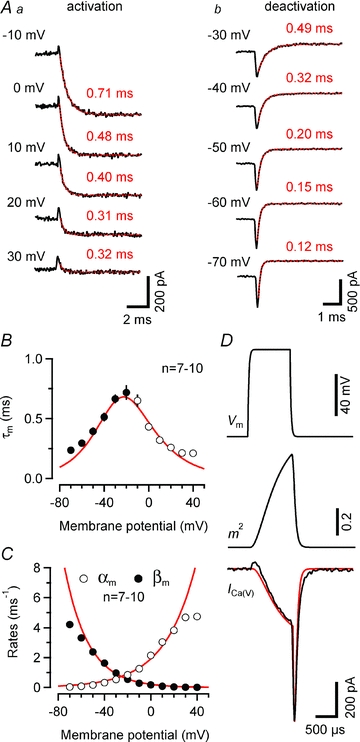
Figure 5. Hodgkin–Huxley model of Ca2+ influx in endbulb terminals.

A, rapid activation (Aa) and deactivation (Ab) kinetics of ICa(V). Smooth red curves represent single exponential fits. Aa, activation of ICa(V) elicited by depolarizing voltage steps from Vh = –80 mV to various Vm values (τA = 0.71, 0.46, 0.40, 0.31 and 0.32 ms for steps to –10, 0, 10, 20 and 30 mV, respectively). Ab, deactivation of ICa(V) after a 10 ms depolarization to 0 mV after stepping back to various Vm values (τD = 0.49, 0.32, 0.20, 0.15 and 0.12 ms for steps to –30, –40, –50, –60 and –70 mV, respectively). B, time constants τm measured from deactivation (–70 to –20 mV, eqn. 3, filled circles) or activation (–10 to 40 mV, eqn. 4, open circles) of ICa(V). The smooth line represents the time constants predicted from the rate constants of the HH-model (τm = 1/(αm+βm)). C, activation (αm) and deactivation (βm) rates of the gate m plotted as a function of Vm. Continuous lines are single exponential fits (eqns (7) and (8)), with α0 = 2.03 ms−1, Vα = 26.5 mV and β0 = 0.22 ms−1, Vβ = 19.8 mV. Potentials >20 and <−60 mV were excluded from the fit. D, comparison of measured and simulated ICa(V) elicited by a 1 ms depolarization to 0 mV. The assumed time course of Vm (top panel) was obtained by digitally filtering a 1 ms step with a single-pole filter (time constant τ = Rs×Cm, where Rs and Cm represent uncompensated series resistance and whole-cell capacitance, respectively). The activation parameter m2 peaked at ∼0.71 (middle panel). Except for a small deviation at the end of the deactivation time course, the simulated ICa(V) (red trace) closely matched the measured current (black trace, bottom panel).
