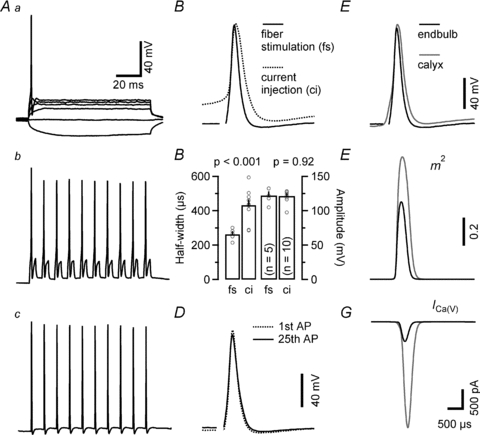
Figure 6. Ca2+ influx during a single presynaptic action potential is significantly less at endbulb versus calyx terminals.

A, presynaptic membrane potential responses to either sustained (Aa, 100 ms duration, –30 to 120 pA) or pulse-like (Ab, 1 ms duration, 180 pA) current injections recorded in current-clamp configuration. B, comparison of presynaptic APs elicited by current injection of afferent fibre stimulation. Initial APs from the trains illustrated in Ab and Ac shown superimposed. C, presynaptic APs elicited by afferent fibre stimulation had shorter half-widths (left) but similar peak amplitudes (right) when compared with those elicited by depolarizing current injections. D, first and last APs elicited by a 100 Hz train consisting of 25 stimuli are shown superimposed to illustrate stability of AP waveform during high-frequency stimulation. E–G, comparison of simulated ICa(V) during presynaptic endbulb and calyx APs. E, endbulb APs (black) were slightly smaller in amplitude and shorter in duration compared to those recorded from calyxes (grey). F, simulated time course of the activation parameter m2. Because of its larger amplitude and longer duration, the calyceal AP waveform opened presynaptic VGCC more efficiently than the endbulb AP. G, simulated ICa(V) during presynaptic APs in endbulb (black) and calyx (grey) AP. On average, the simulated presynaptic ICa(V) was ∼6 times smaller for endbulb terminals compared to the simulated current for calyx terminals. The time scale bars in panels Aa and G also apply to panels Ab, Ac and B, D, E and F, respectively. Vm was −80 mV.
