
Figure 7. Single channel current of VGCCs expressed in endbulb and calyx terminals.
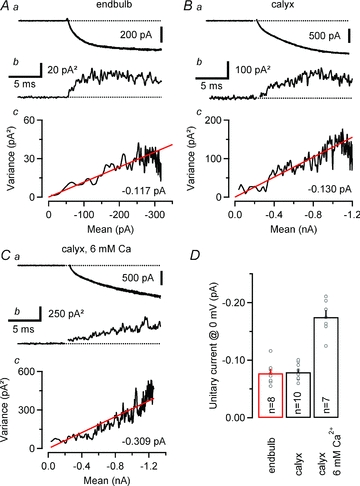
Ensemble variance–mean analysis of ICa(V) recorded at relatively low Vm in an endbulb (A, Vm = –13 mV, 74 repetitions) and two calyx synapses at 2 mm (B, Vm = –15 mV, 65 repetitions) and 6 mm (C, Vm = –10 mV, 65 repetitions) external Ca2+. Seven consecutive sweeps are shown superimposed in the top row (Aa, Ba and Ca). The corresponding variance traces are shown below (Ab, Bb and Cb). Variance was estimated from difference traces (eqn (10)) to optimally eliminate trends and drifts, and background variance was subtracted. Ac, Bc and Cc, variance–mean plots for the same terminals. Red lines represent linear fits to the initial slop after the variance was corrected for the contribution from the background. The estimated unitary currents i were –0.117 pA, –0.130 pA and –0.308 pA for the endbulb and the two calyx terminals, respectively. D, summary data obtained from 8 endbulbs and 10 calyces. The expected unitary current amplitudes at Vm = 0 mV (i(0)) were calculated according to eqn (12). For comparison, the estimated i(0) at elevated external Ca2+ (6 mm) is shown.