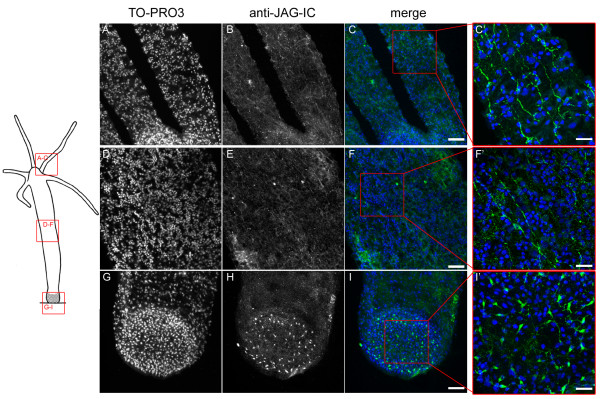
Figure 10.
Nerve cell staining of HyJagged. Left hand panel: Schematic representation of an adult hydra; regions imaged in A-I are indicated; (A, D, G) DNA staining of stacks of confocal sections with TO-PRO3, (B, E, H) anti-JAG-IC staining, (C, F, I, C', F', I') merged images in false colours: DNA (blue), anti-JAG-IC staining (green); C'F' and I' are magnifications of C, F and I as indicated by red boxes; scale bars: (A-I) 50 μm, (C', F', I') 20 μm.

