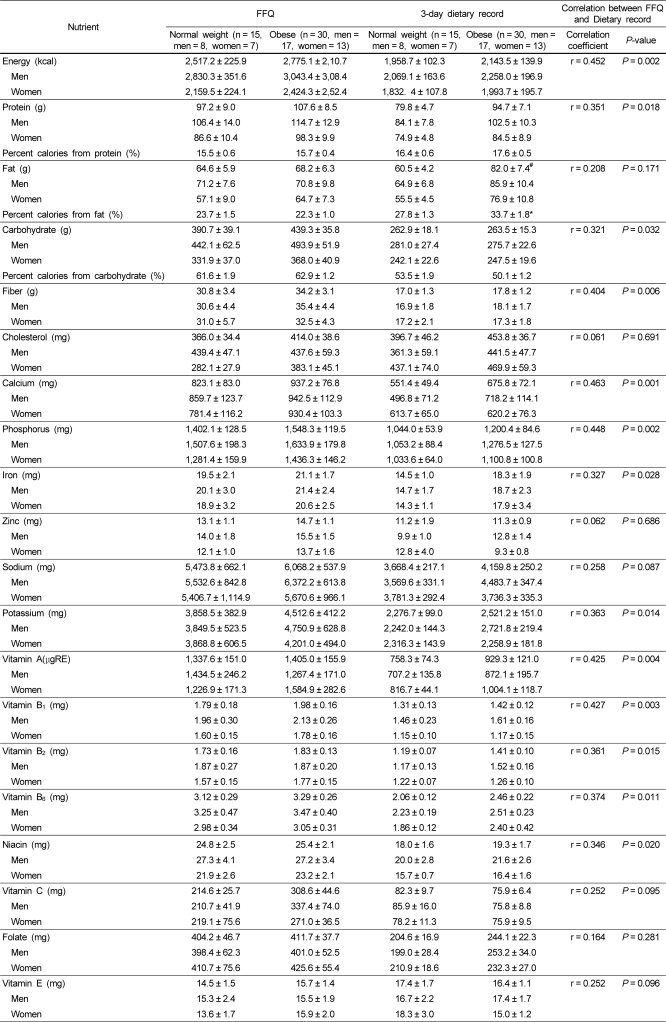
Table 4.
Nutrient intake of subjects assessed with a FFQ and 3-day dietary record
Values are means ± SEM.
*Significantly different from the normal weight group by the Student's t-test (P = 0.032).
#Tended to be different from the normal weight group by ANOVA (P = 0.065).
Correlation was determined by a Pearson correlation.
FFQ, Food frequency questionnaire

