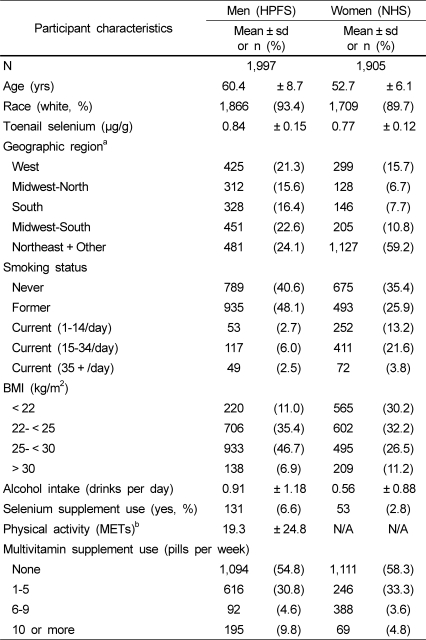
Table 1.
Demographic and lifestyle characteristics in the NHS (1980-1982) and HPFS (1986)
aGeographical regions were grouped based on selenium levels and locations.
West: AZ, CA, CO, ID, MT, NM, NV, OR, UT, WA, WY HI
Midwest/north: IA, KS, MI, ND, NE, SD, WI MN
South: AL, FL, LA, MS, TN, TX, AR, GA, OK
Midwest/south IL, IN, KY, MO, VA, SC, NC, OH, WV
Northeast and other: DE, MD, NJ, DC, AK, CT, GU, MA, ME, MI, NH, NY, PA, PR, PI, VI, VT
bMetabolic equivalents (METs) per week were calculated in men, whereas the average recreational physical activity levels were assessed qualitatively in women.
NHS, Nurses' Health Study: HPFS, Health Professionals Follow-up Study: BMI, Body Mass Index

