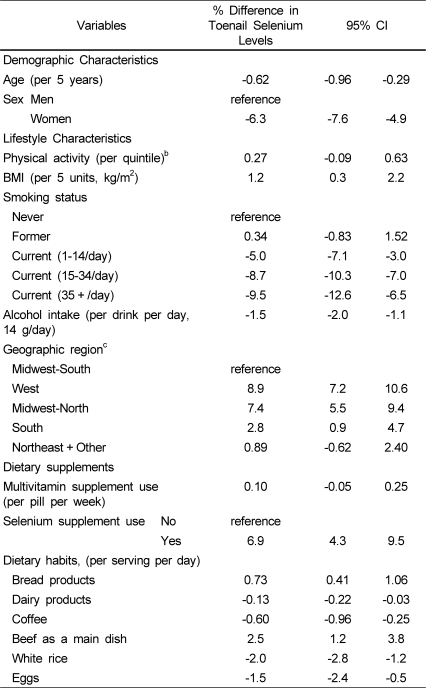
Table 2.
Independent demographic, lifestyle, and dietary determinants of toenail selenium levelsa
aMultivariable-adjusted findings including each of the variables in the Table. Independent dietary predictors were identified using stepwise regression (see Methods).
bMetabolic equivalents (METs) per week were calculated in men, whereas the average recreational physical activity levels were assessed qualitatively in women.
cWest: AZ, CA, CO, ID, MT, NM, NV, OR, UT, WA, WY HI
Midwest/north: IA, KS, MI, ND, NE, SD, WI MN
South: AL, FL, LA, MS, TN, TX, AR, GA, OK
Midwest/south IL, IN, KY, MO, VA, SC, NC, OH, WV
Northeast and other : DE, MD, NJ, DC, AK, CT, GU, MA, ME, MI, NH, NY, PA, PR, PI, VI, VT

