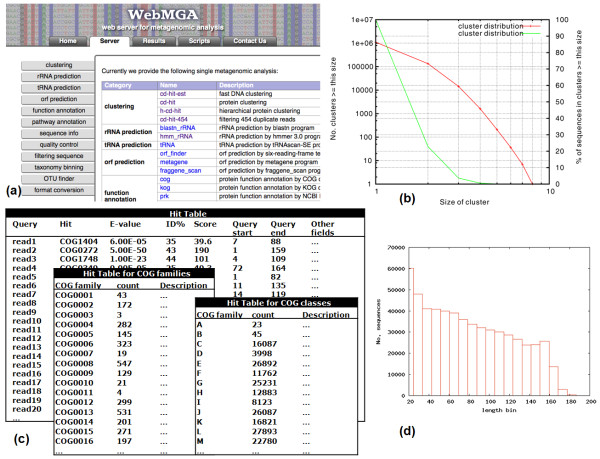
Figure 2.
A screenshot and examples of output results of WebMGA. (a) A screenshot of WebMGA server (b) A plot of distribution of clusters by CD-HIT (c) COG annotation results are in several "TAB" delimited text files, which can be easily viewed locally. (d) A plot of length distribution by sequence statistical tool

