
Figure 7.
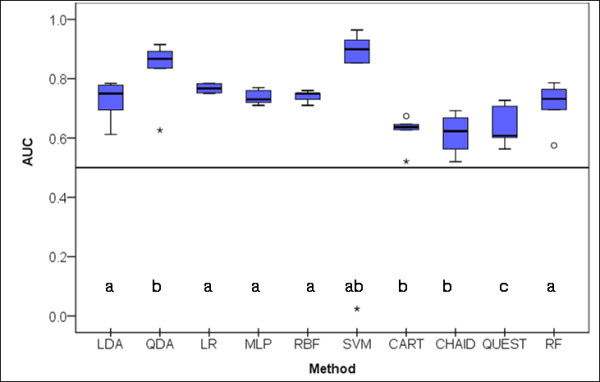
Box-plot distributions of area under the Receiver Operating Characteristic curve (AUC) (see text for abbreviations) (X2Fr(9)= 23.745; p = 0.005). Different letters indicate statistically significant differences between classifiers on a multiple mean rank comparison procedure. Circles and stars represent outliers and extreme outliers respectively.