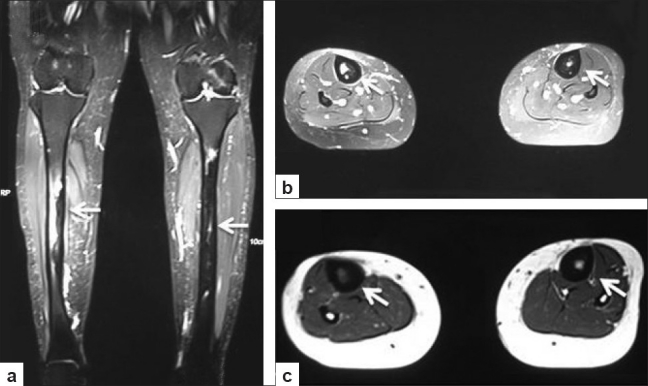
Figure 3.

Short tau inversion recovery coronal (a) and axial (b) images show cortical thickening (arrows) with bone marrow edema in bilateral tibial diaphysis. Also noted is minimal adjacent soft tissue edema. T1W axial (c) image shows diffuse cortical thickening better
