Fig. 8.
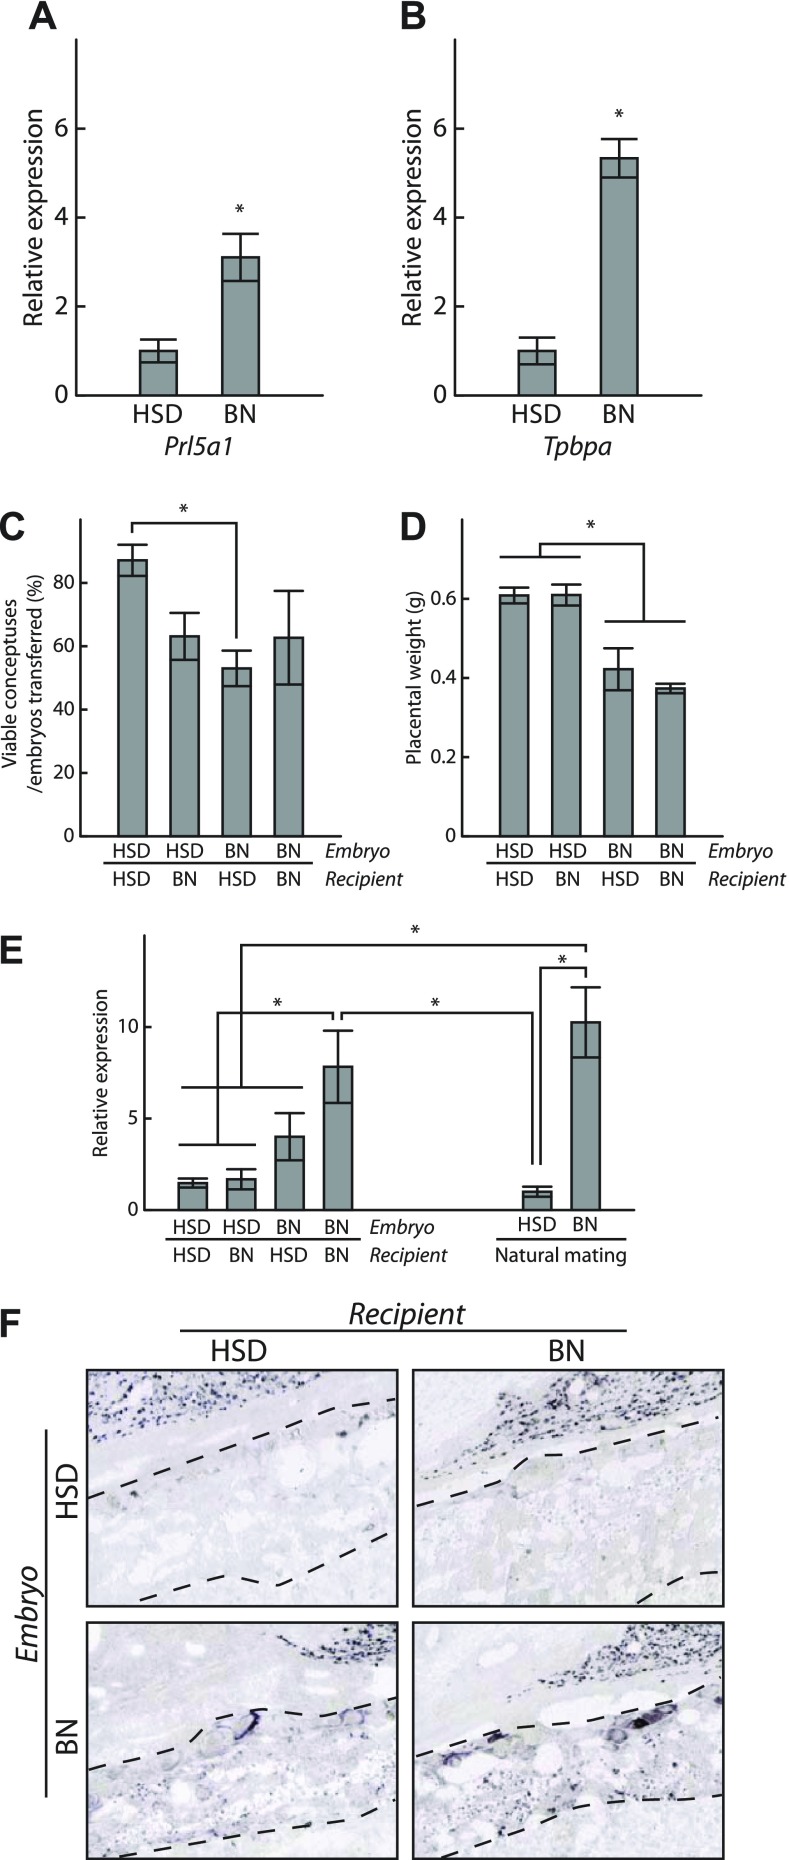
Trophoblast and maternal impact on Prl5a1 expression. A and B: HSD and BN TS cells were compared for their expression of Prl5a1 and Tpbpa. TS cells were differentiated for 12 days and transcript levels were analyzed by qRT-PCR. C–F: analysis of placentation sites from HSD-BN reciprocal embryo transfers (HSD embryos transferred to HSD recipients, n=6; HSD embryos to BN recipients, n=9; BN embryos in HSD recipients, n=5; BN embryos in BN recipients, n=4). Viability of placentation sites (C), placental weights (D), qRT-PCR junctional zone Prl5a1 transcript levels (E), and distribution of Prl5a1 transcripts (F) were determined on gestation day 18.5. Data were analyzed initially by ANOVA followed by Tukey contrast tests. *Significant differences (P < 0.05).

