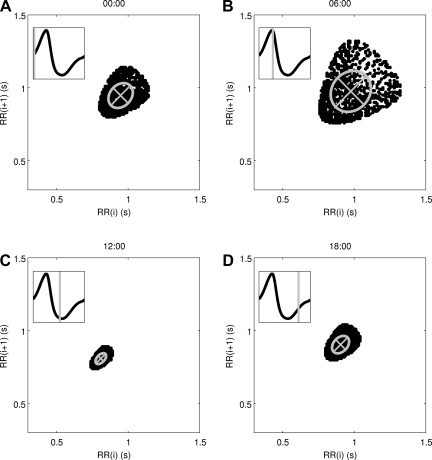
Fig. 4.
Poincaré maps of RR intervals in homeostasis, at 00:00 (A), 06:00 (B), 12:00 (C), and 18:00 (D). Inset in each figure: the circadian pattern of Tpar and the region that was used to generate the Poincaré map. The ellipses represent the dispersion of points as the axes are equal to the standard deviation of points on each axis. The major and minor axes of the ellipses are drawn on the figure, representing the standard deviations along the y = x diagonal (SD1) and the y = −x diagonal (SD2). A large circadian pattern in the geometry of the Poincaré maps is observed, ranging from a maximum of (SD1, SD2) = (0.13, 0.15) in B to a minimum of (0.027, 0.046) in C.

