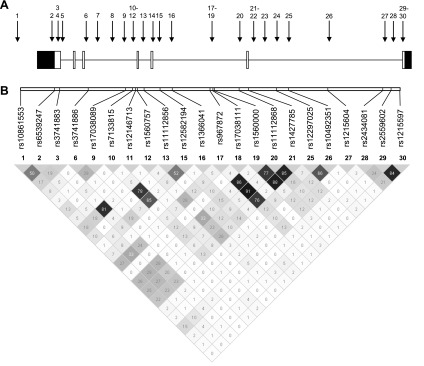
Fig. 3.
Location of the selected SNPs in NUAK1. A: the locations of the SNPs are indicated by the arrows with numbers (cfr. Table 1). Exons and introns are depicted as boxes and lines, respectively. White boxes are exons and black boxes are untranslated regions. B: pairwise r2 was estimated and is displayed by a gray-shaded square with the hundredths of r2 value inside (Haploview). Darker shades of gray indicate higher degrees of linkage disequilibrium (LD).

