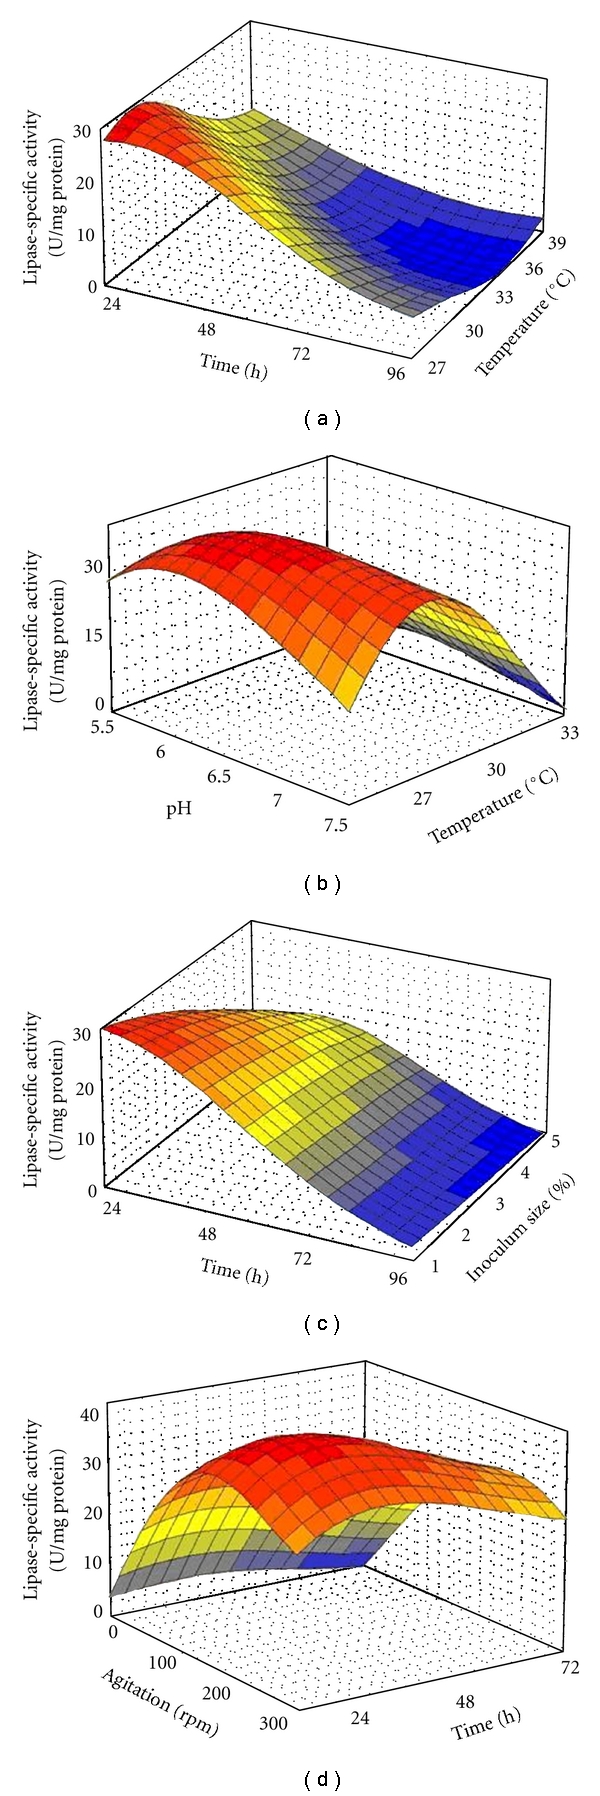
Figure 1.

Three dimensional plots for the interaction effect of: (a) time and temperature; (b) pH and temperature; (c) time and inoculum size; (d) agitation and time on Acinetobacter sp. lipase production in SmF. The colors from blue to gray, green, yellow, orange, and red, respectively, show increasing the lipase-specific activity.
