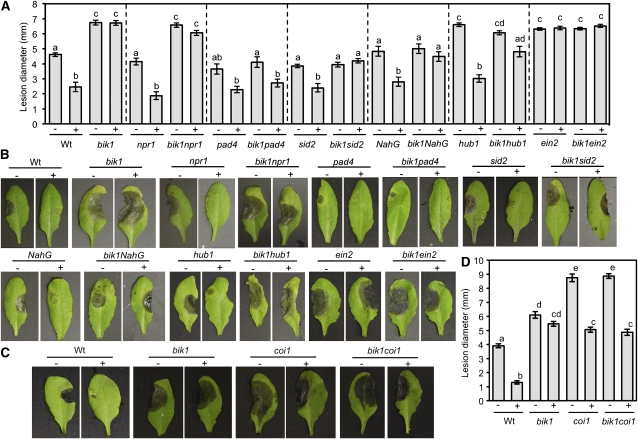
Figure 8.
Epistasis Analysis of the Interaction between BIK1 and Other Immune Response Genes in flg22-Induced PTI to B. cinerea.
Lesion diameter ([A] and [D]) and disease symptoms ([B] and [C]) in water (−) and flg22 (+) pretreated single and double mutants after drop inoculation with B. cinerea (2.5 × 10⁵ spores/mL). Data in (A) and (D) represent mean ± se from a minimum of 30 disease lesions. Experiments were repeated at least three times with similar results. Statistical analysis was performed as described in the legend of Figure 2. Images were taken 3 d after inoculation. Wt, wild type.

