Figure 1.
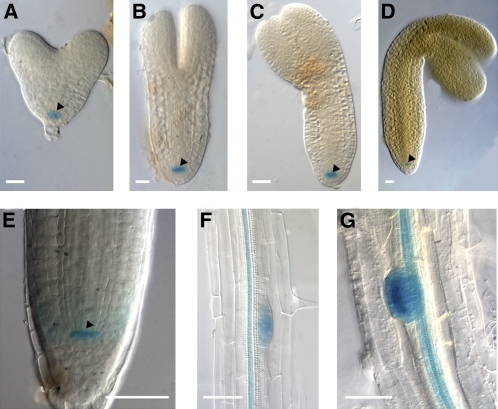
RopGEF7 Expression Profile Analysis during Embryogenesis and Seedling Root Development.
(A) to (D) Detection of RopGEF7pro:GUS expression in the precursor cells of the QC at the heart (A), torpedo (B), bent cotyledon (C), and mature (D) embryo stages. GUS staining was for 16 h.
(E) to (G) Detection of GUS activity in a 5-d-old RopGEF7pro:GUS seedling in the QC of a primary root tip (E), mature zone of a primary root (F), and lateral root primordia (G). GUS staining was for 6 h.
Arrowheads indicate the QC. Bars =20 μm in (A) to (D) and 50 μm in (E) to (G).

