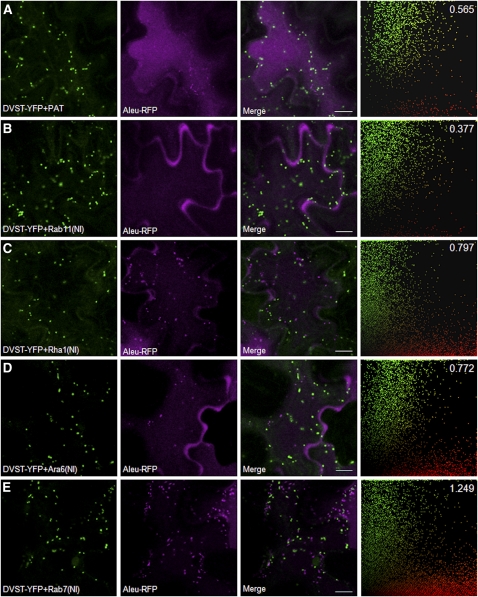
Figure 4.
Rha1, Ara6, and Rab7 Mutants Cause Accumulation of Aleu-RFP in Post-Golgi Structures.
The same samples analyzed in Figure 3 were imaged at the cell cortex at higher magnification to visualize individual organelles in the cytosol and to assess accumulation of Aleu-RFP (purple) in intracellular compartments in transit to the vacuole. The far right panels show scatterplots derived from the correlation analysis performed using the PSC plug-in for ImageJ (French et al., 2008) and show ST-YFP signals in green and Aleu-RFP signals in red rather than purple due to software characteristics. At least 400 individual punctate structures were manually masked on a minimum of 20 independent images or 400 independent punctae for each coexpression pair. The overall sum of green and red pixels was quantified, and the red/green ratio was calculated and is shown in the top right corner. Notice that in all cases, the vacuolar marker Aleu-RFP can be visualized in post-Golgi punctate structures in transit to the vacuole, as no overlap with the Golgi-marker was detected, but the amount of post-Golgi red fluorescence relative to the internal marker ST-YFP is increased in (C) and (D) and particularly (E). Bars = 10μm.

