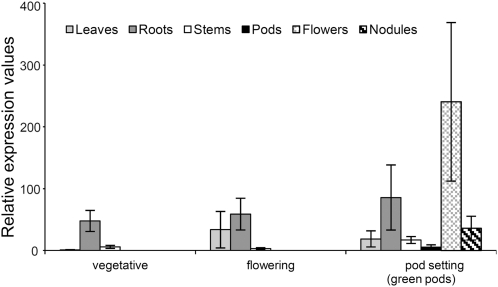
Figure 7.
Expression Analysis of CYP716A12 Gene in Control Line (E113) by Quantitative RT-PCR: Different Organs at Different Phenological Stages Were Considered.
Data are shown for leaves (light gray bars), roots (dark gray bars), stems (white bars), pods (black bars), flowers (light cross-hatched bars), and nodules (dark cross-hatched bars).
Values are means ± se of three biological replicates (three plants/replicate) and are expressed relative to leaves in the vegetative stage.

