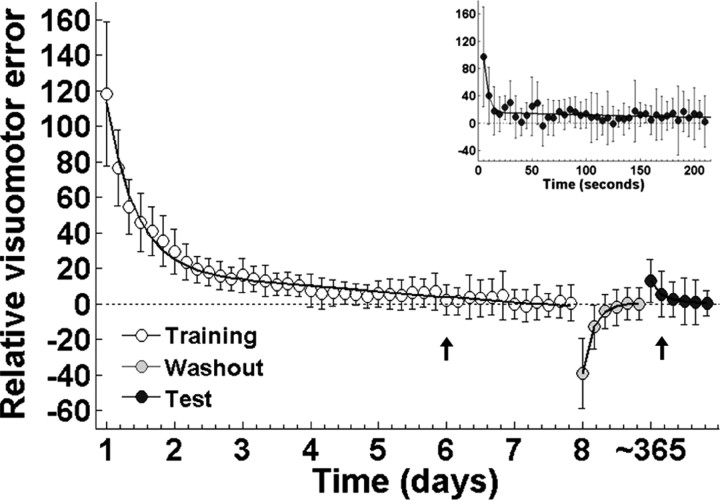
Figure 1.
Time course of visuomotor error as a function of time. Symbols represent mean ± SD for visuomotor error. Error was fit with a double exponential function for adaptation (left, white symbols), washout (middle, gray symbols), and test (right, black symbols). Baseline is depicted by a dotted straight line. Time to adaptation both during adaptation and test is depicted by an arrow. Inset shows a detail of the decay in visuomotor error (averaged every 5 s) during the first block of readaptation at test.

