Figure 1.

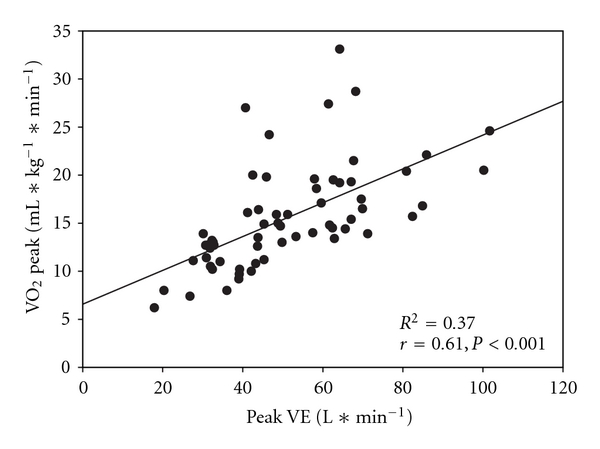
Scatterplot with a regression line overlay to demonstrate the relationship between VO2 peak and peak minute ventilation (VE).

Scatterplot with a regression line overlay to demonstrate the relationship between VO2 peak and peak minute ventilation (VE).