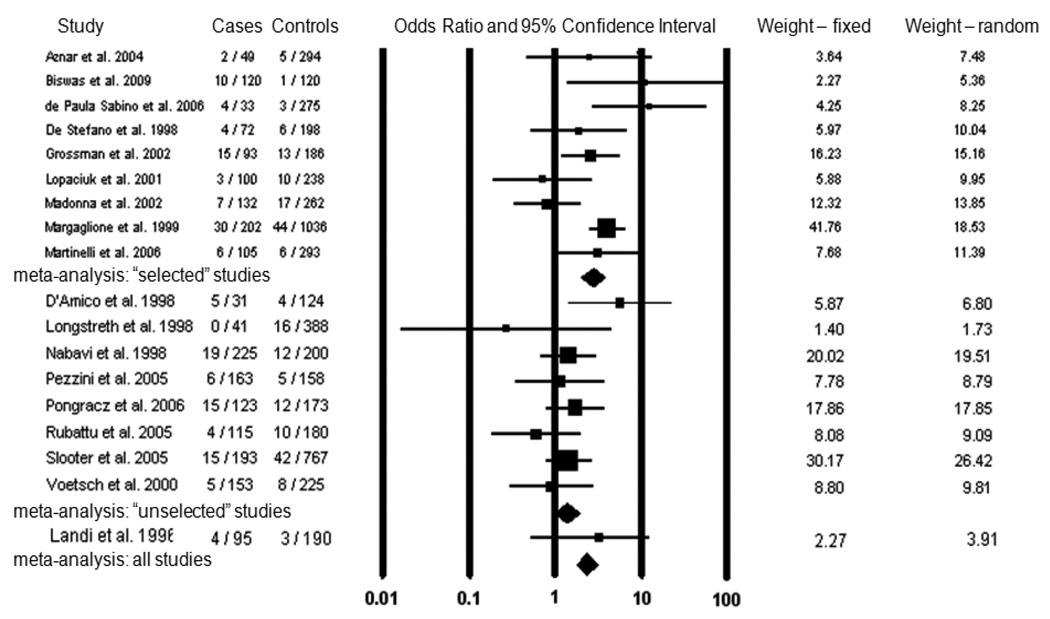
Figure 2.
Meta-analysis of Factor V Leiden and ischemic stroke in young adults. For each study, the number of individuals with Factor V Leiden and the total number of individuals are indicated for both case and control populations. The odds ratio for each study is given by a square, the size of which is proportional to the sample size, and a horizontal line denotes the 95% confidence interval. The pooled odds ratio for “selected” studies, “unselected” studies, and all studies under a fixed effects model is represented by a diamond.

