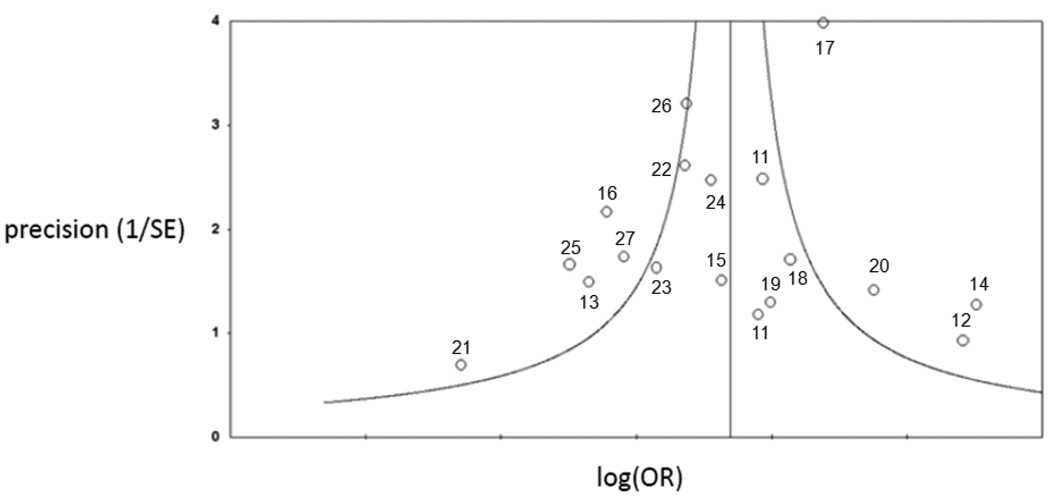
Figure 3.
Funnel plot of studies included in meta-analysis of Factor V Leiden and ischemic stroke in young adults. Each point on the graph represents an individual study in the meta-analysis. The number beside each point corresponds to the reference number for that study. The curved lines represent the expected distribution of studies, and the vertical line indicates the log of the pooled odds ratio.

