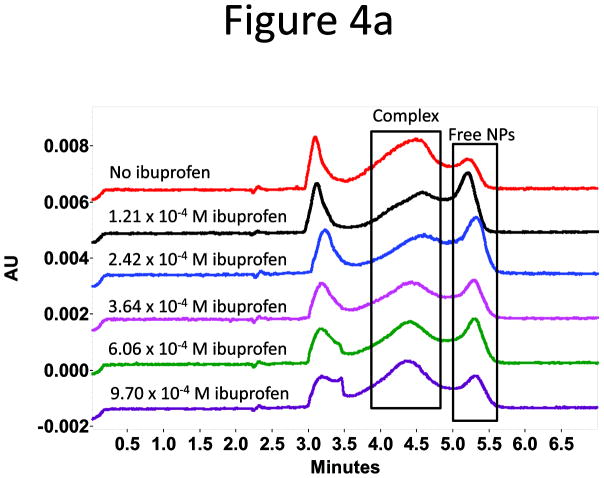
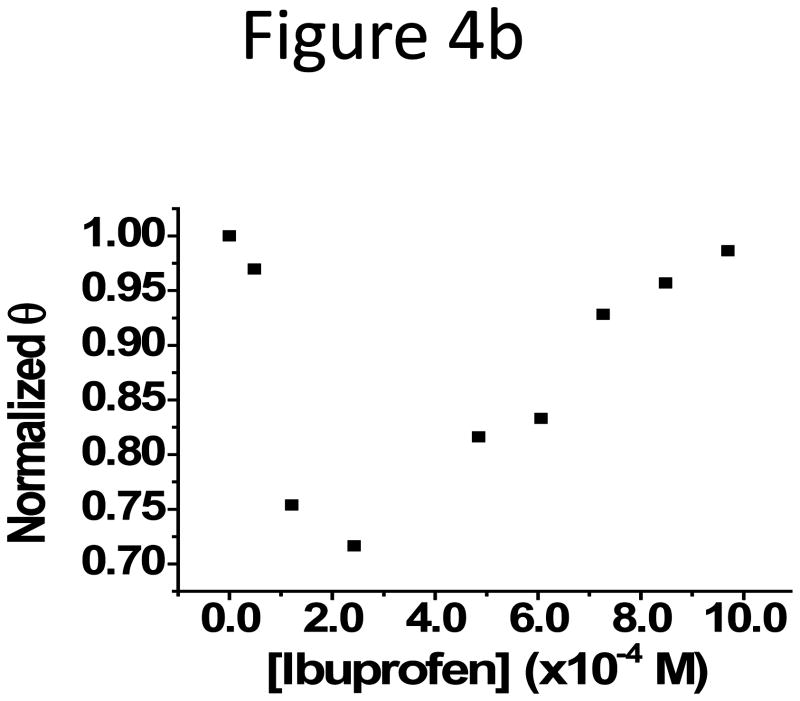
Figure 4.
(a) Representative electropherograms attained at 288 nm for the study of competitive binding to HSA between ibuprofen and PAA-Fe3O4 NPs. HSA peak appeared at 3.0 min, and the free ibuprofen showed up at around 3.4 min. (b) Normalized θ (the fraction of protein-bound NPs) was plotted against the drug concentration.


