Figure 4.
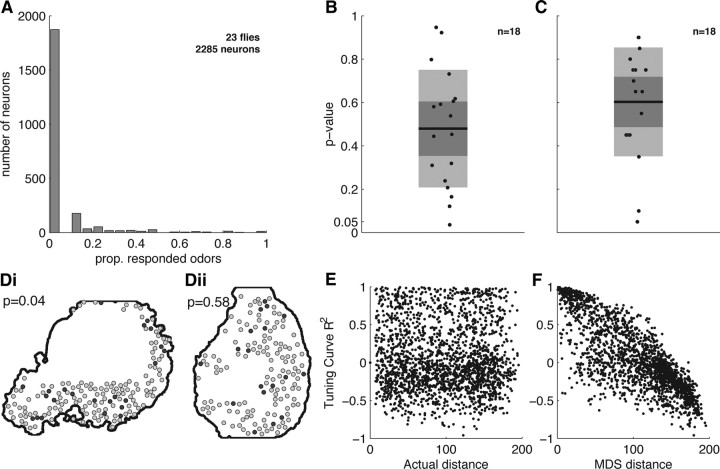
Random spatial distribution of responding MB neurons in the cell body layer. A, The proportion (prop.) of odors eliciting a response from each cell (lifetime sparseness). The vast majority of cells do not respond to any tested odor (peak at zero). B, Distribution of p values from a permutation test for clustering of responsive neurons within an optical section. Each data point represents one optical section from an individual fly. Light gray boxes indicate standard deviation around the mean; dark gray box indicates the 95% confidence interval. Only a single imaging plane showed a nominally significant level of clustering (p = 0.04). See Results for details. C, Distribution of p values from a permutation test for clustering of neurons with similar tuning curves. Each data point represents one optical section from an individual fly. We found no evidence for clustering. D, Example imaging planes showing distributions of responsive cells (dark gray). We observed a section with high clustering value (i) and one with a moderate value (ii); neither showed a visibly striking clustering of responsive neurons. E, Tuning curve correlation as a function of distance between cells from a single fly. F, Tuning curve correlation as a function of distance in MDS space (see Results) for the fly shown in E. This plot illustrates that obtaining topography is possible with the tuning curves we observed experimentally.

