
Figure 6.
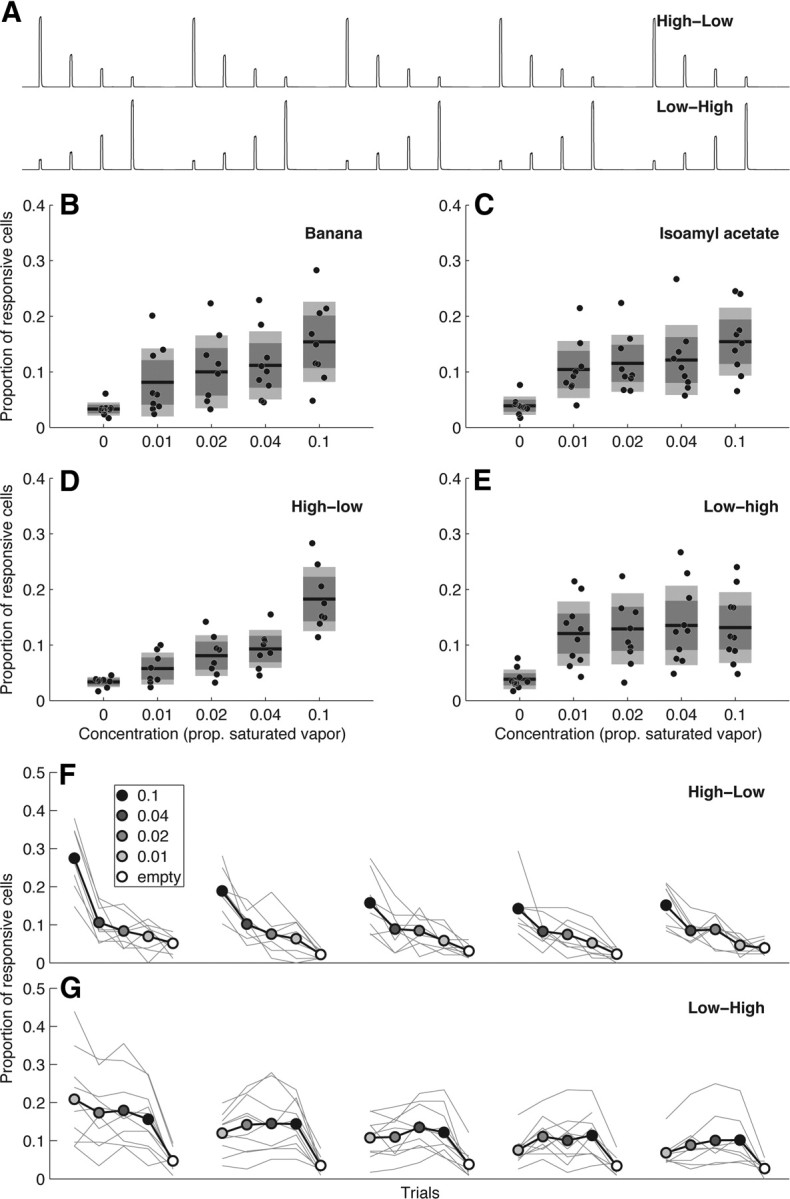
The effects of odor concentration and recent stimulus history on MB population sparseness. A, Stimuli were delivered in blocks of either increasing or decreasing concentration steps, shown here as the average PID traces acquired during each type of experiment (for details, see Results). B, Proportion of Kenyon cells responding to ripe banana over a range of different odor concentrations. Mean sparseness increases slightly with concentration, but never exceeds 0.2. Each point is the MB response from an individual fly for each concentration from both types of stimulus blocks (jittered along the x-axis for clarity); black bars indicate the mean of these points. Light gray boxes indicate standard deviations around the mean and dark boxes indicate the 95% confidence interval. C, Same as B, but for the monomolecular odor isoamyl acetate. D, Data from B and C showing specifically the results from the high-to-low concentration steps. E, As D, but the low-to-high steps. An effect of concentration is only apparent for the high-to-low condition. F–G, Responses on individual trials over the course of an experiment showing that the order in which stimuli were presented affects the sparseness of MB response. Response to the first trial was typically less sparse than subsequent trials. Additionally, the stimulus block type (high-to-low vs low-to-high) affected how sparseness changed with concentration. Gray lines show sparseness estimates from individual flies. Points connected by the black line indicate the mean responses on individual trials of different odorant concentrations (filled circles) or clean air (open circles). Trial blocks have been separated in time for clarity, but experiments were run continuously.