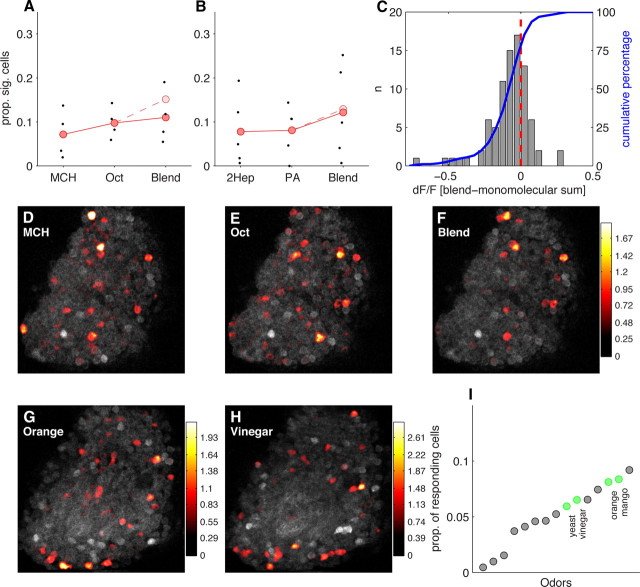
Figure 7.
MB responds sparsely to complex and natural odorants. A, Proportion of KCs responding to 4-methylcyclohexanol (MCH), 3-octanol (Oct), and a 50:50 blend of the two odorants. Points show sparseness values from individual optical sections (n = 4). Grand means shown in red. The sparseness of responses to the blend is very similar to that of the monomolecular components. The pale red point indicates expected proportion of responsive cells if the monomolecular odorants were to sum additively. B, Similar data as A, but from a different experiment using 2-heptanone (2Hep), pentyl-acetate (PA), and their 50:50 blend. C, Responses to blends are predominantly subadditive. Histogram shows the distribution of deviations from linearity for responses to the 3-octanol plus 4-methylcyclohexanol blend compared with the response predicted by linear addition of responses to the individual components. Seventy-three percent of cells responded less to the blend than expected from the sum of the component responses, indicating that the majority of KC responses to the blend are subadditive. D–F, Basal fluorescence (gray) and dF/F overlay (heat map) for responses to 3-octanol, 4-methylcyclohexanol, and the blend of the two odors. Each panel shows data from an individual trial. dF/F values are on the same scale for all panels. G–H, Single-trial responses to two complex natural odors. I, The sparseness values of natural odors (green) compared with a range of different monomolecular odorants (gray). Natural odorants do not evoke responses that are substantially more or less sparse than monomolecular odorants.

