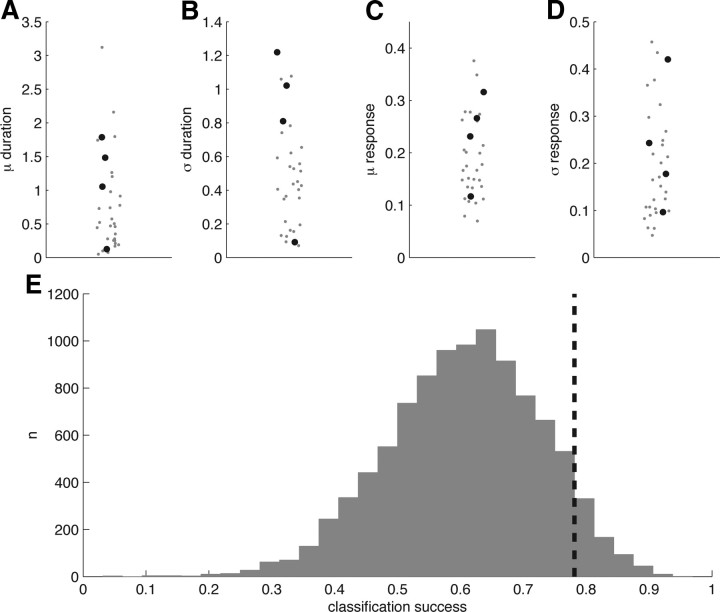
Figure 8.
MB population responses to natural and monomolecular odors are indistinguishable. A, Mean response duration (imaging frames) for natural odors (black circles) and monomolecular odors (gray points). B, Standard deviation of response duration. C, Mean evoked response magnitude. D, Standard deviation of evoked response magnitudes. E, LDA-based classification accuracy of natural and monomolecular responses (78%, dashed black bar) compared against chance performance (gray histogram). Observed classification performance was not significantly greater than that of 10,000 chance bootstrap replicates.

