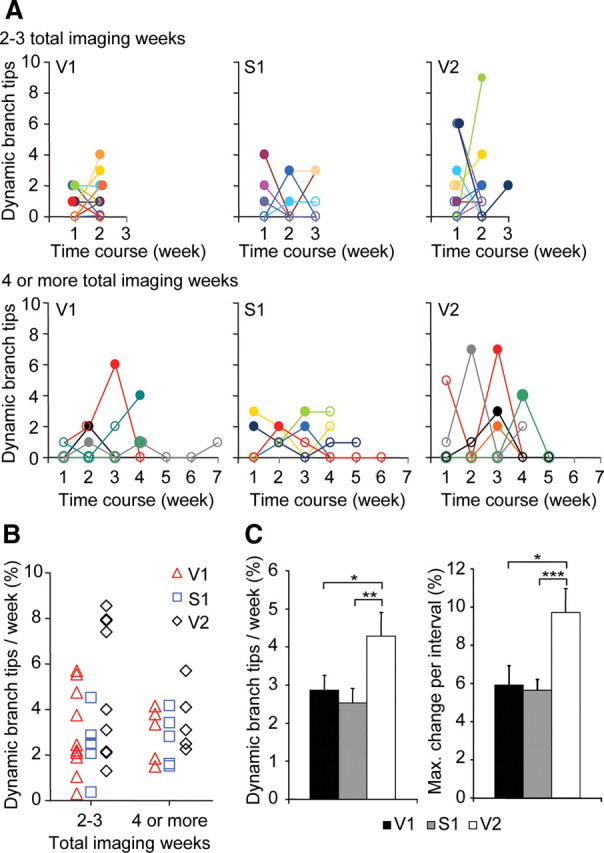
Figure 2.

Interneuron dendritic branch tip dynamics across multiple cortical regions. A, Time course of dynamic branch tips by weekly imaging interval for individual cells in V1, S1, and V2. Filled points indicate maximal weekly branch tip change. Top panels represent cells imaged for 2 or 3 weeks. Bottom panels represent cells imaged for 4 or more weeks. B, Quantification of fractional rate of dynamic branch tips per week for individual cells in V1, S1, and V2. C, Comparison across cortical regions of fractional rate of dynamic branch tips (left) and maximal fractional branch tip change per week (right) (V1: n = 17 cells from 17 mice, 48 dynamic branch tips, 623 total branch tips; S1: n = 11 cells from 11 mice, 45 dynamic branch tips, 485 total branch tips; V2: n = 15 cells from 15 mice, 75 dynamic branch tips, 614 total branch tips) (***p < 0.01, **p < 0.02, *p < 0.05). Error bars, SEM.
