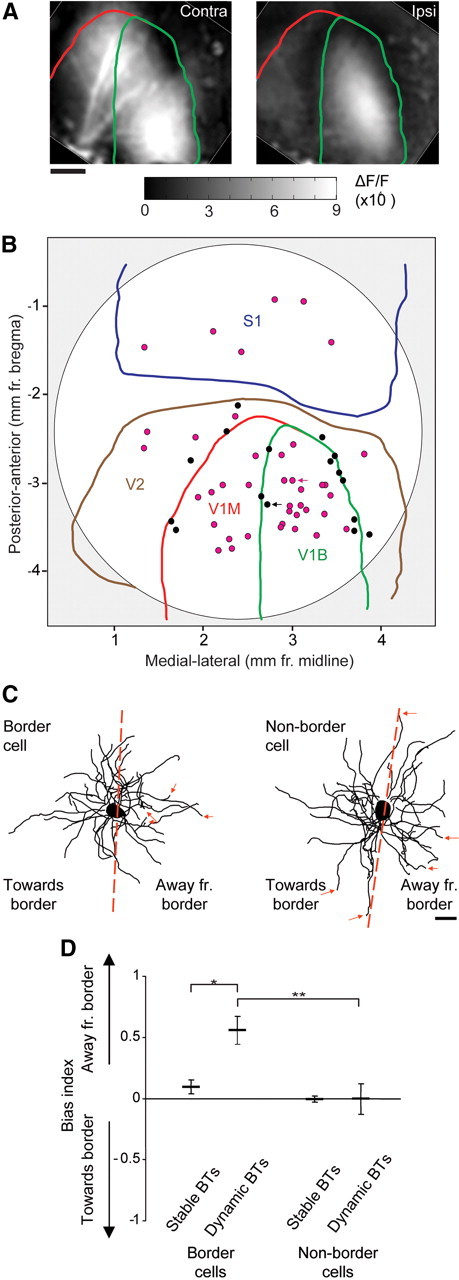
Figure 3.

Dynamic branch tip bias in cells along functional cortical boundaries. A, Map of primary monocular (V1M) and binocular (V1B) visual cortex obtained by optical intrinsic signal imaging of contralateral (left) and ipsilateral (right) eye stimulation. Stereotaxic boundaries from the Franklin and Paxinos mouse brain atlas are overlaid in red (V1M) and green (V1B). B, Overlay of mapped imaged cells with cranial window (white region) and boundaries of respective cortical regions defined. Border cells (<130 μm from the nearest border) are denoted with black circles. Nonborder cells are denoted with magenta circles. C, Example of branch tip bias index calculation of a border cell (black arrow in B) and a nonborder cell (magenta arrow in B). Red dotted line indicates bisecting plane parallel to nearest boundary. Red arrows indicate dynamic branch tips. D, Quantification of branch tip bias for stable and dynamic branch tips in border and nonborder cells (border cells, n = 16; nonborder cells, n = 37) (**p < 0.002, *p < 0.005). Error bars, SEM.
