Figure 2.

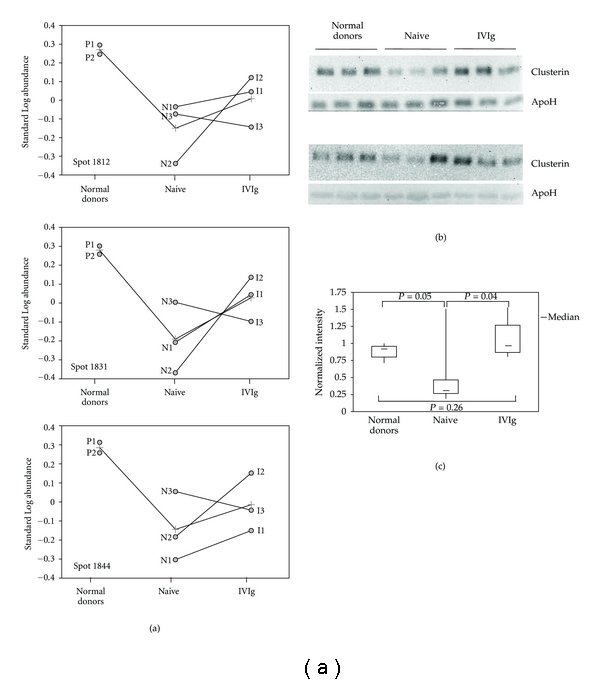
Clusterin expression in CVID. (a) The panel shows the graphic output of DeCyder software (BVA module) for spots 1812, 1831 and 1844, further identified as clusterin. The line connecting normal donors (pools P1 and P2), naive patients (N1–N3), and IVIg-treated patients (T1–T3) in each of the panels represents average levels of the corresponding protein spot. The lines connecting naive samples to the corresponding IVIg-treated samples denote the change in protein expression after one-year substitutive therapy for each of the three patients. (b) Western blot analysis of clusterin in serum samples from normal donors, naive, and IVIg-treated patients. The experiment was performed on individual serum samples from normal donors and newly enrolled, naive and IVIg-treated patients. Each gel was loaded with serum samples from three healthy controls, three naive patients, and three IVIg-treated individuals for >5 years. The filters were first incubated with clusterin antibodies, then with an apolipoprotein H antibody for individual normalization of protein contents. (c) The normal serum with highest normalized expression of clusterin was set to 1, for relative analysis of normalized clusterin expression in the samples loaded on the western blot of Figure 2(b). The data were then used to build the shown box plot. The bottom and top of each box represent the 25th and 75th percentile, respectively; the thick band inside each box shows the 50th percentile (the median). The ends of the whiskers represent the minimum and maximum values of each group of data. The brackets indicate the statistical comparisons between groups with the corresponding P values.
