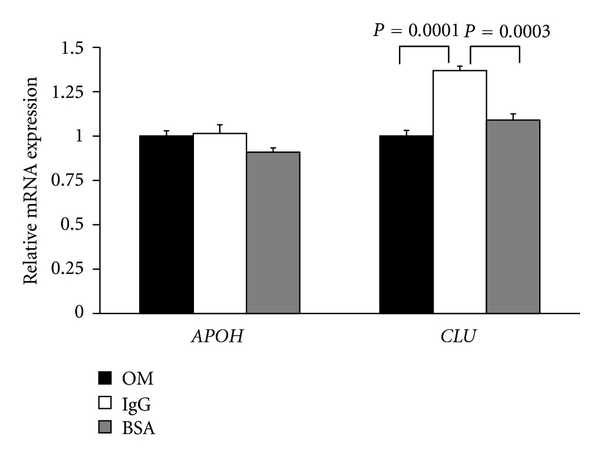
Figure 3.

Real-time PCR analysis of clusterin transcript expression in HuH7 cells treated with immunoglobulins. The chart shows the expression of apolipoprotein H (APOH) or clusterin (CLU) transcripts in HuH7 cells adapted to culture in Opti-MEM (OM: black bars), or treated with immunoglobulins (Ig: white bars) or bovine serum albumin (BSA: gray bars). The bars indicate the average expression levels and the observed standard deviations. The expression levels of CLU or APOH transcripts were normalized to β-actin mRNA levels.
