
Figure 2.
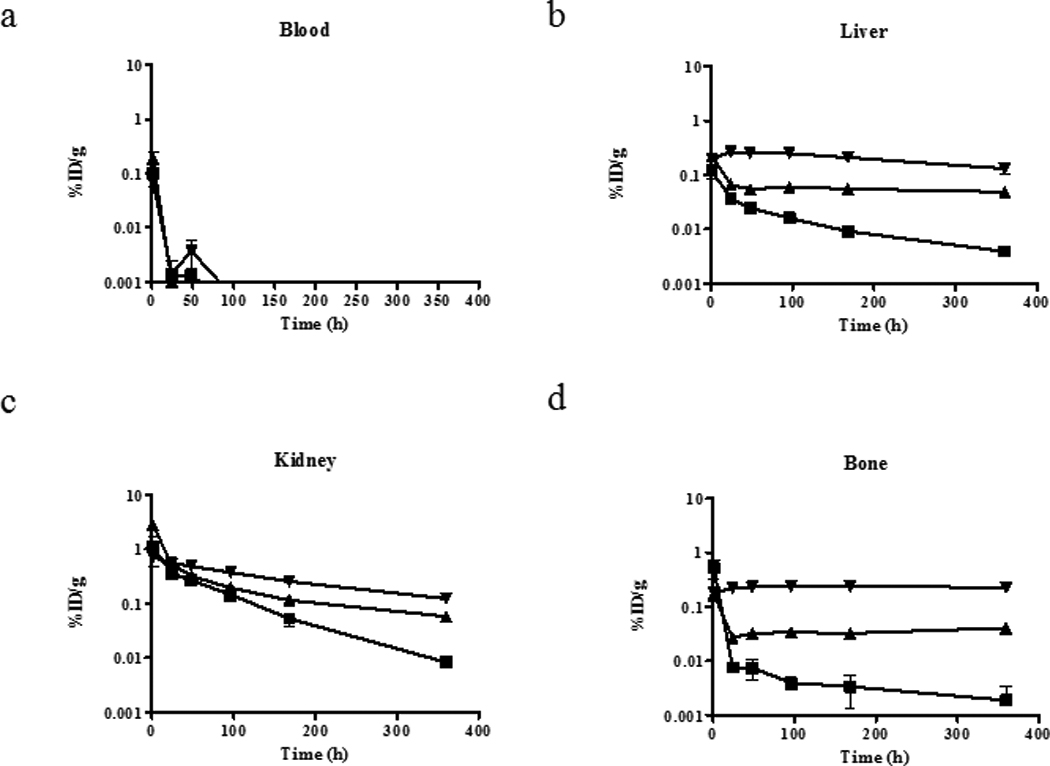
Biodistribution results of 153/NatGd-DOTA (■), 153/NatGd-DTPA-BMA (▼) and 153/NatGd-DTPA (▲) in WT mice over time. Selected tissues are presented, and note the scale differences in the y-axes, which are displayed on a log scale. The mean ± SD is displayed at each time point, but error bars representing the SD may not be observed if it is small. Even after 15 days, more activity is observed in the tissues of mice that received 153/NatGd-DTPA-BMA and suggests that this complex is not as stable in vivo as 153/NatGd-DOTA and 153/NatGd-DTPA.