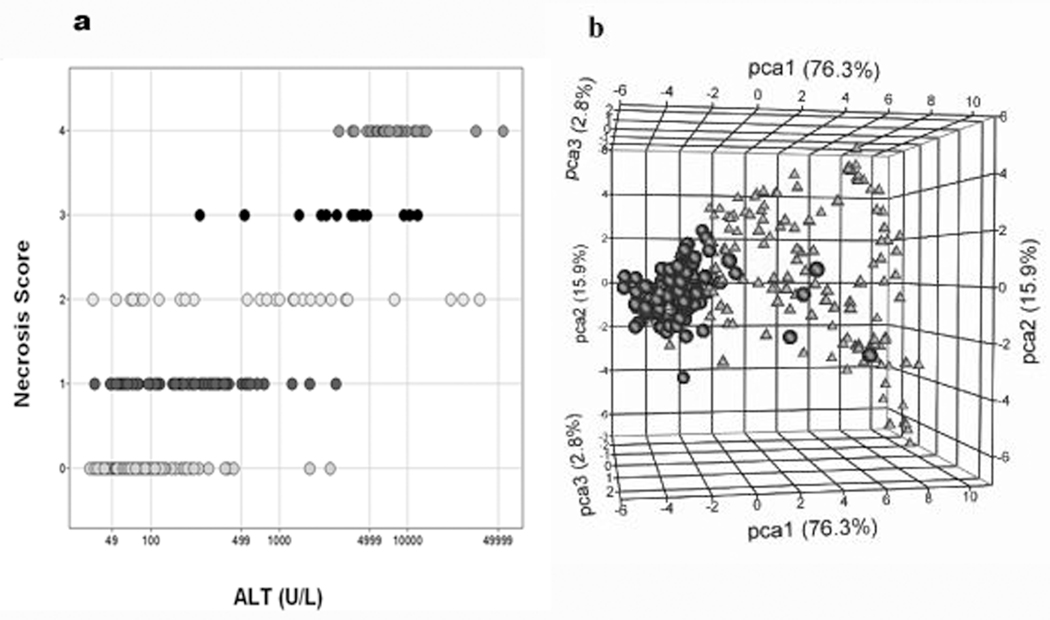
Figure 1.
The Compendium data set samples partitioned by necrosis of the liver. a) Distribution of the samples by ALT (x-axis) and necrosis score (y-axis). Necrosis score: 0 (164 samples), 1(82 samples), 2 (29 samples), 3 (14 samples), and 4 (29 samples). The total number of samples is 318. b) Principal component analysis (PCA) of liver samples labeled according to an indication of necrosis. PCA was performed on the liver expression data from the six genes selected from the blood signature using a Welch t-test with P <0.05 and a fold change (FC) >2.0 filtering criteria in ArrayTrack to compare the two classes of samples. Triangles = class 1 (154 samples showing some form of liver necrosis), circles = class 0 (164 samples showing no sign of necrosis)]. The percent of variation captured by the first three principal components (PCs): PC1=76.3% (x-axis), PC2=15.9% (y-axis), and PC3=2.8% (z-axis).

