Figure 2.
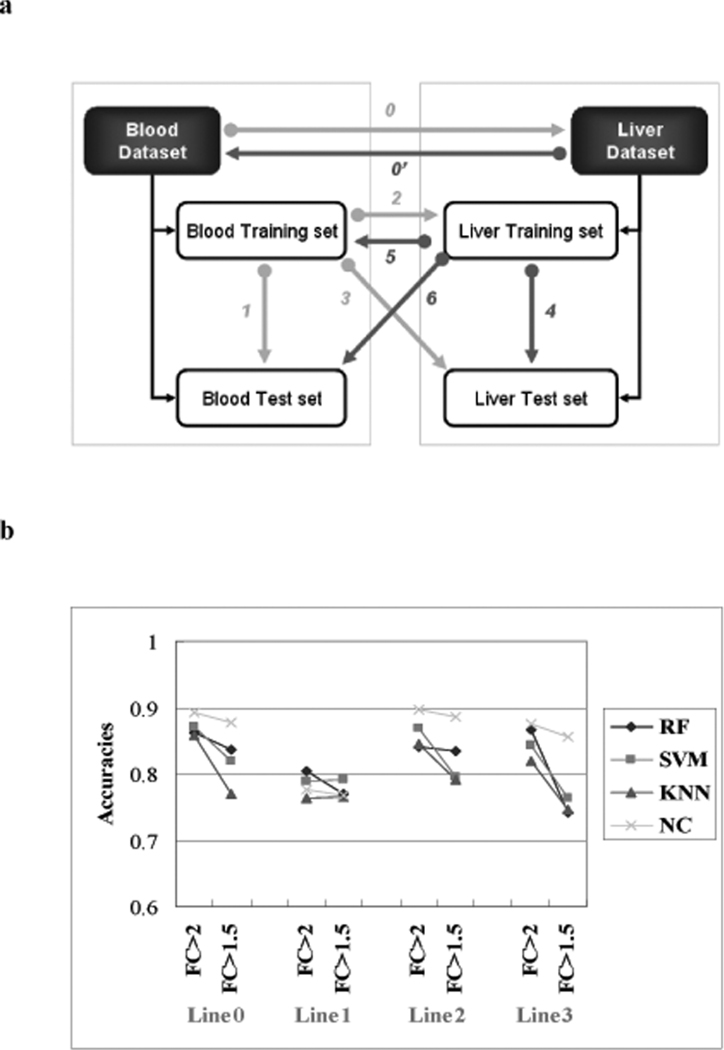
Prediction across tissues. a) Strategies for building classifiers and making predictions. The line numbers represent the strategy taken. Line 0: Building the classifiers on the entire blood data set to predict the same data set profiled in the liver. Line 1: blood training set was used for training the model and for prediction of the blood test set. Line 2: using the classifiers built on the blood training data to predict the liver training data. Line 3: using the classifiers built on the blood training data to predict the liver test data. Line 0' and 4–6 are the reciprocal predictions from liver to blood. b) Gene-based classifier predictions from the blood to the liver. The x-axis represents the strategies taken to build classifiers and make predictions. The line numbers are as denoted in Figure 2a. FC means the fold change used to select the predictor genes (P <0.05). The y-axis represents the accuracy of prediction (from the average of 100 trials). RF-random forest (# of trees = 100), SVM – support vector machines (RBF kernel), KNN – k-nearest neighbors (k=15), NC-nearest centroids. SVM, KNN and NC were individually combined with a forward array feature selection method (Welch t-tests), evaluated with a five-fold internal cross validation to select best genes in the model construction.

