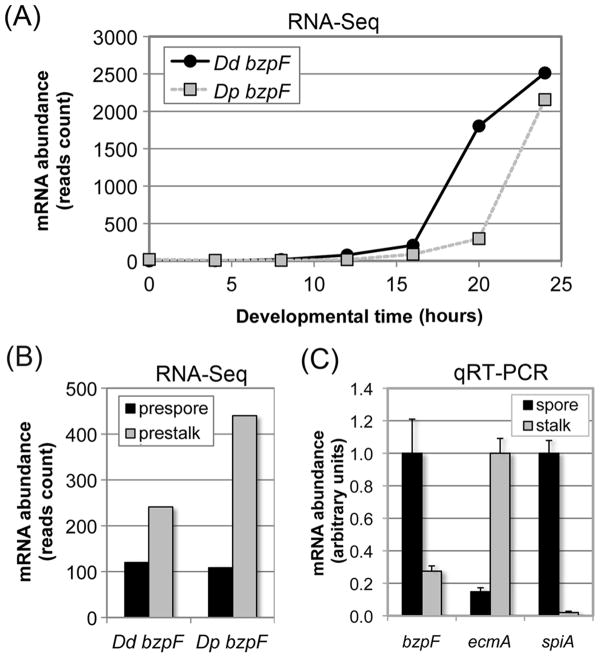
Fig. 2. bzpF is expressed during late development in D. discoideum and D. purpureum.
(A) The expression profile of bzpF during development: Adapted from the published RNA-sequencing data of D. discoideum (Dd bzpF, black circles) and D. purpureum (Dp bzpF, grey squares) (Parikh et al., 2010b). Time points (hours) are indicated on the x-axis and mRNA abundance (normalized read-counts) on the y-axis.
(B) Preferential expression of bzpF in prestalk cells: Adapted from the published RNA-sequencing data of D. discoideum (Dd bzpF) and D. purpureum (Dp bzpF) (Parikh et al., 2010b). bzpF mRNA is detectable in both prespore cells (black bars) and prestalk cells (gray bars) in slugs. The y-axis indicates mRNA abundance (normalized read counts). (C) Preferential expression of bzpF in spores: We performed quantitative RT-PCR on RNA from spores (black bars) and stalk cells (grey bars) enriched from mature D. discoideum fruiting bodies. The enrichment of the isolated cell types is illustrated with the stalk-specific marker ecmA and the spore-specific marker spiA. The sample with the most abundant mRNA was normalized to 1 unit (y-axis) for each gene. The data are represented as mean + s.e.m of four replicates.

