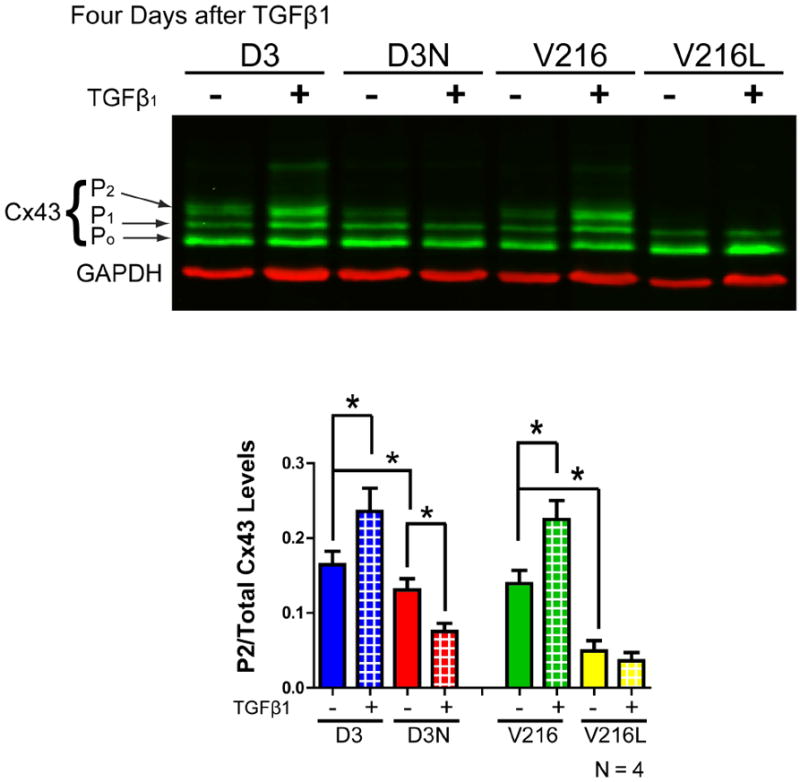
Figure 7.

Cx43 levels (green) in untreated and TGFβ1 treated D3, D3N, V216 and V216L fibroblasts as assessed by Western blot. Three species of Cx43 were resolved reflecting various phosphorylation states where the lowest band was denoted as P0, the middle band as P1 and the highest band as P2. Four days after D3, D3N, V216, and V216L fibroblasts were treated with TGFβ1, the levels of the P2 Cx43 phosphorylated species as compared to total Cx43 levels was significantly increased in D3 and V216 fibroblasts but this increase was not observed in D3N and V216L fibroblasts. GAPDH was used as a loading control (red). *p<0.05
