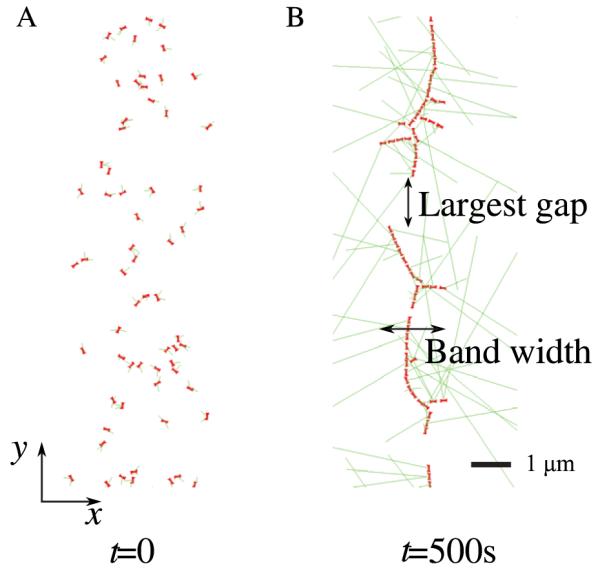
Figure 3.

Snapshots of simulations showing the initial node distribution in (A) and nodes condensed into a ring structure in (B). The x-axis is parallel to the long axis of the cell; the y-axis is arc length along the cell circumference. Nodes are initially distributed according to a Gaussian distribution of standard deviation 0.9 μm along the x-axis and according to a uniform distribution along the y-axis [14]. Panel (B) shows largest gap and band width.
