Fig. 2a.

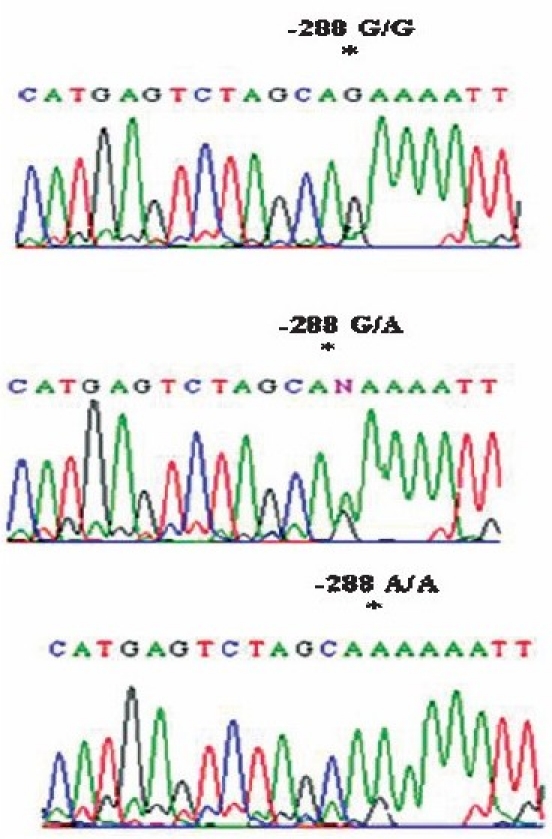
Partial chromatograms representing (a) the homozygous G/G, A/A genotype and (b) the heterozygous G/A genotype at position-288 in the TLR3 promoter region depicting G/A variation.

Partial chromatograms representing (a) the homozygous G/G, A/A genotype and (b) the heterozygous G/A genotype at position-288 in the TLR3 promoter region depicting G/A variation.