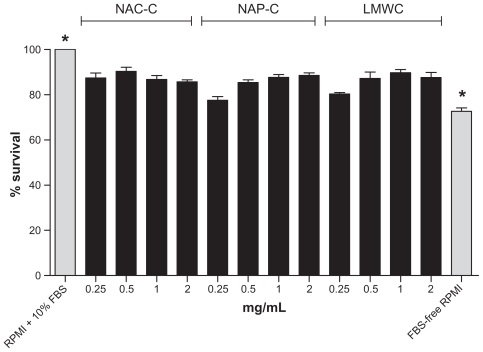
Figure 2.
The effect of different concentration (0.25, 0.5, 1, 2 mg/mL) of polymers (NAC-C, NAP-C, LMWC) on T47D cancer cell proliferation 48 hours after treatment compared with positive control (RPMI + 10% FBS) and negative control (FBS-free RPMI). The data are mean ± SD of three experiments in four wells. In ANOVA tests all the data were compared to controls demonstrating a significant difference (P < 0.0001).
Note: *Significantly different from all other groups.
Abbreviations: ANOVA, analysis of variance; NAC-C, N-acetyl cysteine-chitosan; NAP-C, N-acetyl penicillamine-chitosan; LMWC, low-molecular-weight chitosan; RPMI, Roswell Park Memorial Institute medium; FBS, fetal bovine serum; SD, standard deviation.

