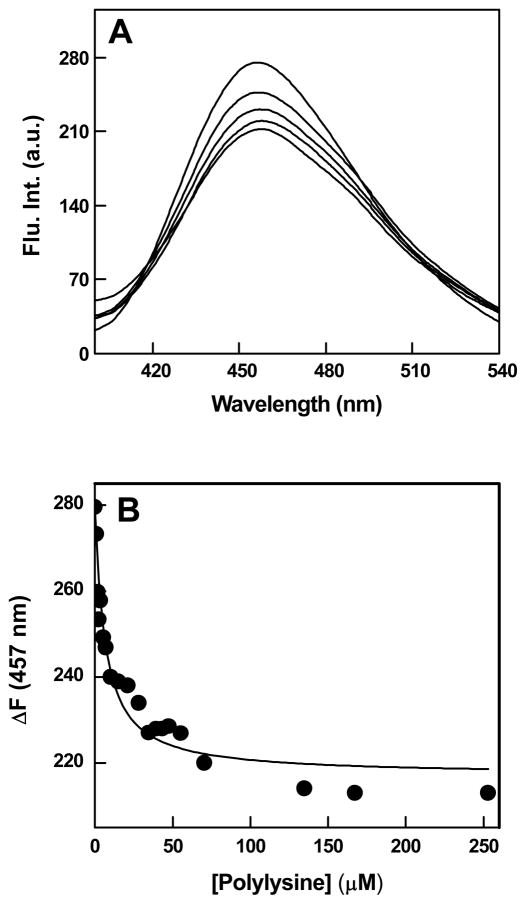
Figure 5.
Fluorescence spectral changes upon binding of polylysine with hCA XII-DNSA complex. Panel A shows the fluorescence emission spectra of hCA XII-DNSA complex in the presence of increasing concentrations of polylysine. The experiments were performed in 25 mM HEPES buffer, pH 7.5 containing 10% Acetonitrile. [hCA XII] = 1 μM, [DNSA] = 5 μM, polylysine = [1-253 μM], λex = 330 nm. Panel B shows the binding isotherm for the interaction of polylysine with hCA XII- DNSA complex. The decrease in the fluorescence emission intensity of hCA XII-DNSA at 457 nm (derived from the data of Panel A) was plotted as a function of polylysine concentration. The solid smooth line is the best fit of the data for the dissociation constant of hCA XII(DNSA)-polylysine complex as being equal to 6 ± 0.9 μM.

