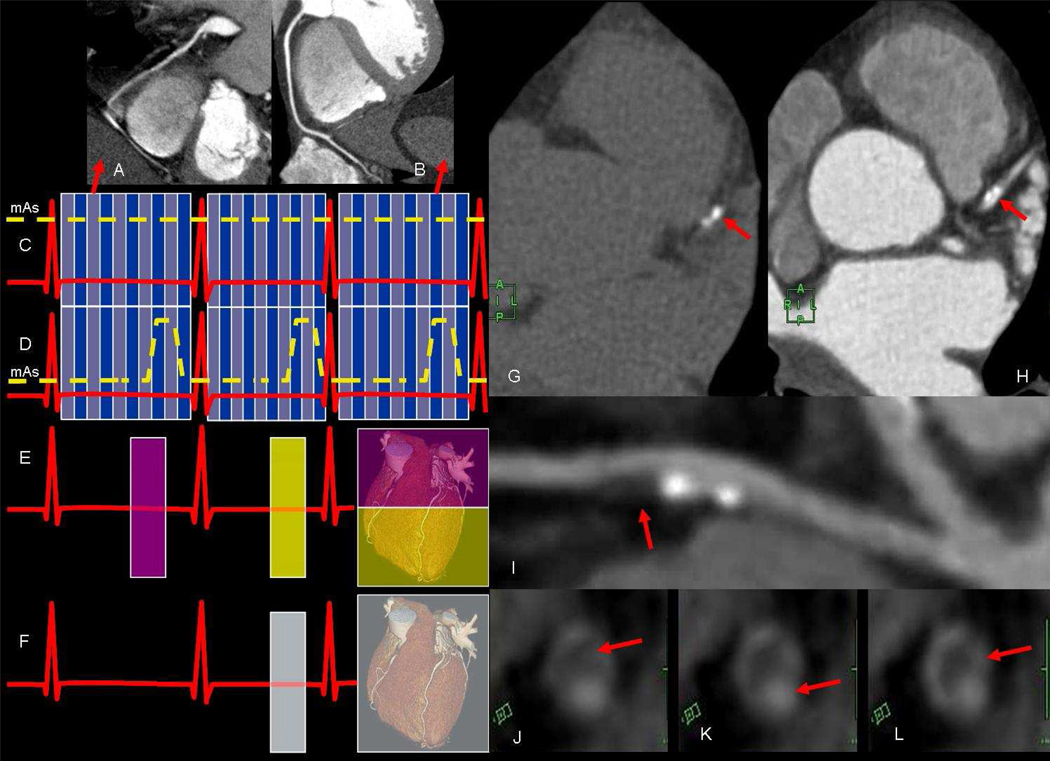
Figure 1.
a) coronary CT. scan angiography during systole and b) diastole showing superior image quality of the latter due to longer quiescent period in diastole. Schematic scan modes during c) retrospective electrocardiographic (ECG) gating without dose modulation (blue lines show division of the R-R interval into 10 phases of the cardiac cycle) d) retrospective ECG gating with dose modulation to reduce effective ration dose. Schematic diagram of prospective scan modes using e) step-and shot technique in 2 heart beats (e.g. using 256 detector rows) f) or single heart beat for wider coverage (320 detector rows). Coronary CT g) without and h) with contrast showing calcification (red arrows) in the left anterior descending coronary artery (LAD). Multi-planer reformatted image of the same LAD showing the extent of the non-calcified plaque which appears to as large as the calcified portion. Cross sectional CT images of another coronary artery showing the j) low density non-calcified plaque k) causing severe narrowing of the lumen and l) enhancement of the vessel wall.

