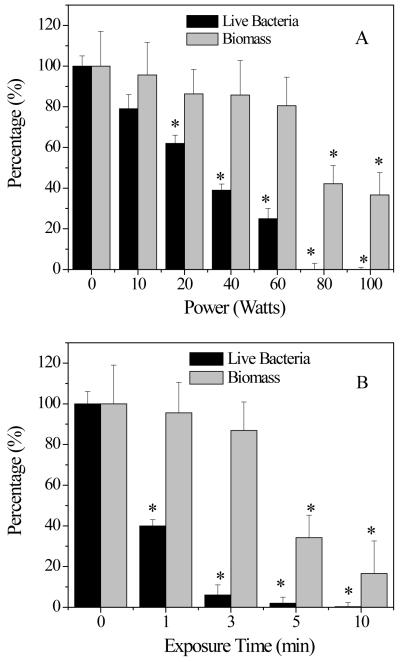
Figure 4.
Discharge gases caused bacterial death (A) and biomass loss (B) in 1-day old S. aureus biofilms. Total biomass and bacterial viability in biofilms were determined by CV and MTT staining, respectively. Experimental conditions: A) discharge gas: argon; exposure time: 5 min; power: 0-100W; gas flow rate: 2.4 ft3 h−1 . B) discharge gas: argon; exposure time: 0-10 min; power: 100W; flow rate: 2.4 ft3 h−1 .
In Fig. 4A, “Power (Watts)” should read “Power (W)” and “Live Bacteria” should read “Live bacteria”
In Fig. 4B, “Exposure Time” should read “Exposure time” and “Live Bacteria” should read “Live bacteria”

