Figure 6.
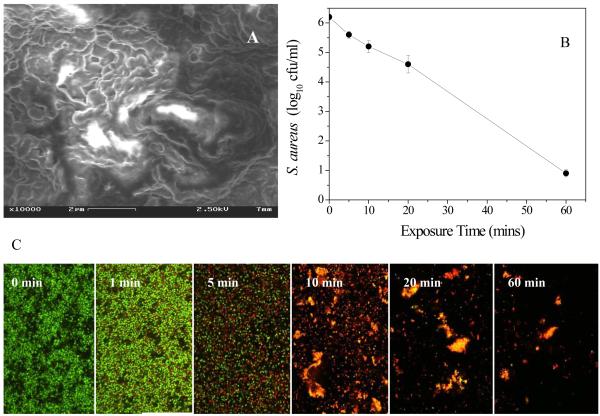
A) SEM image of 7 -day old S. aureus biofilms; B) confocol images of stained (Live/Dead kit) 7 -day old S. aureus biofilms treated with discharge argon (power: 100W; gas flow rate: 2.4 ft3 h−1 ). (Exposure time is indicated on each image.) C) Viability of S. aureus (as measured by MTT assay) in 7 -day old biofilms treated with discharge argon under the same experimental conditions as described in Figure 6B.
In Fig. 6B, “Exposure Time” should read “Exposure time” and “cfu/ml” should read “cfu ml−1”

