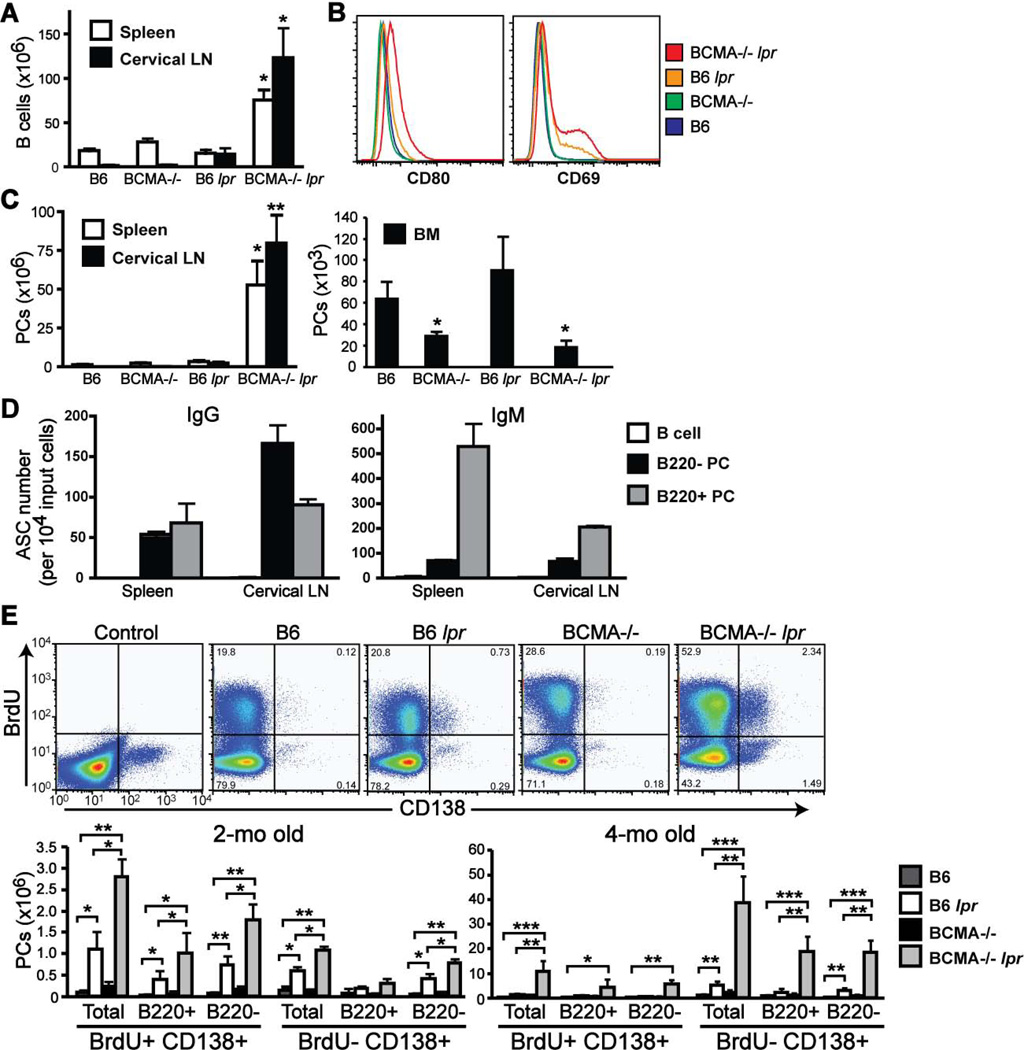
Figure 4. Lymphoproliferation in BCMA−/− lpr mice is accompanied by increased numbers of both short- and long-lived PCs in spleen and cervical LNs.
(A, C) Total numbers of B cells (B220+ CD138−) and PCs (B220+/− CD138+) in spleen, cervical LNs, and bone marrow (BM) of 4-mo-old mice were quantified. n = 5–6 mice per group. *, p < 0.05; **, p < 0.01 compared to wild-type and single-mutant strains. (B) Histograms comparing expression of CD80 and CD69 on B220+ CD138− gated B cells. All data are representative of 3–5 mice per genotype. (D) B cells, B220+ PCs, and B220− PCs were sort-purified from spleen and cervical LNs of individual 4-mo-old BCMA−/− lpr mice, and were analyzed for the number of IgG and IgM antibody secreting cells (ASC) by ELISPOT. Data are expressed as the mean ± SEM from 4–6 mice per group and is representative of three independent experiments. (E) Numbers of BrdU− PCs resident in spleens of BCMA−/− lpr mice increase with age. Groups of 2-mo- and 4-mo-old mice were fed BrdU in the drinking water at 1 mg/ml for 10 days. Spleens were isolated and analyzed for BrdU uptake within total CD138+ PCs, B220+ PCs, and B220− PCs. Representative FACS plots for each genotype at 2-mo of age demonstrate both BrdU− and BrdU+ CD138+ PCs are present in spleens. The ratio of cells within each quadrant is shown. Total numbers of BrdU+ and BrdU− CD138+ PCs were quantified. In addition, the numbers of BrdU+ and BrdU− CD138+ PCs that expressed B220 or not, relative to FMO control, were quantified. Data shown represent mean ± SEM for 5 mice per group. *, p < 0.05; **, p < 0.01; ***, p < 0.001 compared to B6 or B6 lpr mice, as indicated.

